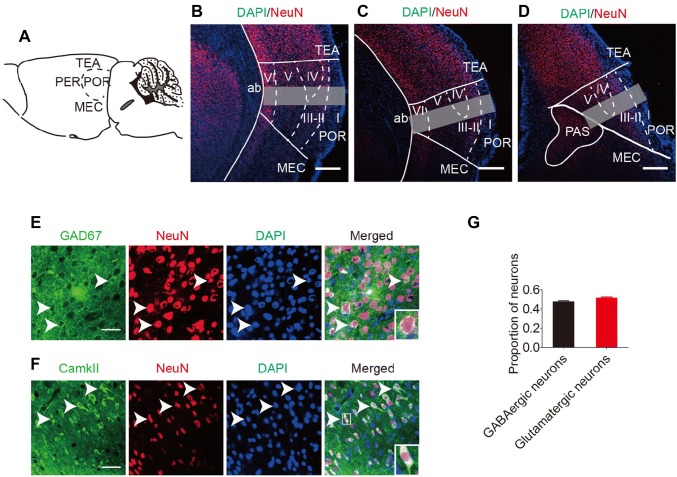
Fig. 1.
Identification of postrhinal cortex (POR) borders and neuronal composition in the mouse. A Lateral surface view of the POR borders. B–D Schematic of the POR shows 3 rostrocaudal levels in the coronal plane. Gray rectangles indicate the cell-counting regions (scale bars, 250 μm). AP: B, −4.70 mm; C, −4.85 mm; D, −5.00 mm. TEA, temporal association area; PER, perirhinal cortex; Entl, lateral entorhinal area; PAS, parasubiculum area. E, F POR neurons co-labeled for (E) GAD67 (green) and NeuN (red) or (F) CamkII (green) and NeuN (red) are indicated by arrowheads (scale bars, 50 μm). G Proportions of GABAergic (48.4% ± 1.6%) and glutamatergic (51.4% ± 1.8%) neurons in the POR. Data are presented as mean ± SEM.

