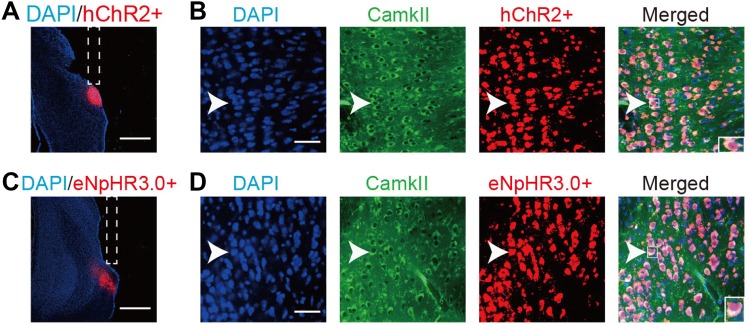
Fig. 2.
Implant location of fibers and expression of hChR2 and eNpHR3.0 in the POR. A, C hChR2 and eNpHR3.0 expression in the POR and implant location of fiber (scale bars, 750 μm). B, D CamkII (green) stained with hChR2 or eNpHR3.0 (red); arrowheads, co-labeled neurons. hChR2 or eNpHR3.0 expression occurred only in CamkII+ neurons (scale bars, 50 μm).

