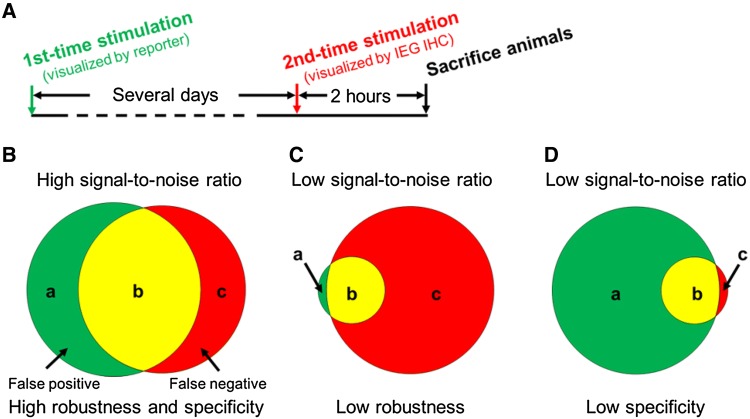
Fig. 2.
Experimental procedure to quantify the robustness and specificity of IEG-dependent tools. A Two identical stimuli are applied several days apart (based on the literature [66, 85, 88] and our own tests, the exact time interval between the two stimuli may depend on the tools, brain regions, and behavioral paradigms used) to induce signals in the IEG-dependent tool and endogenous IEG, respectively. B Signals of an IEG-dependent tool are divided into two parts: false positives (neurons only labeled by the IEG-dependent tool, a); and true positives (neurons labeled by both the IEG-dependent tool and endogenous IEG staining, b). The third category, false negative signals (c) are neurons only labeled by endogenous IEG staining. We quantify the robustness of an IEG-dependent tool as b/(b+c), and its specificity by b/(a+b). Examples of low robustness (C) and low specificity (D) are shown. A given IEG-dependent tool needs to have both high robustness and specificity to have a high signal-to-noise ratio.

