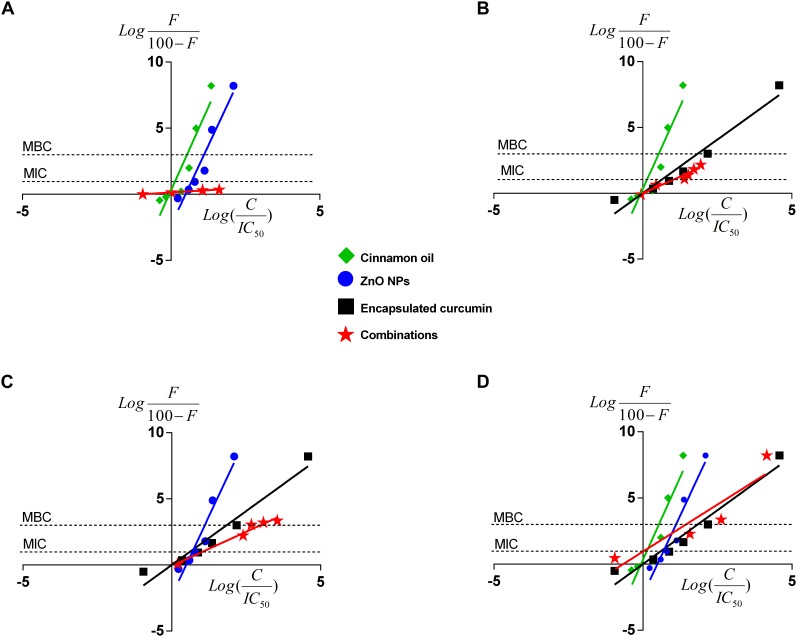
FIGURE 6.
Median-effect plots of cinnamon oil, ZnO NP, and encapsulated curcumin against C. jejuni F38011 strain after 3-h treatment at 37°C in a microaerobic condition. Data were plotted for single or dual treatments as binary (A–C) or tertiary combinations (D). F represents the percentage reduction of bacterial cells. C means the antimicrobial concentration and H is the slope hill of concentration-effect curves. Each line represents the effect of single or combinational antimicrobial treatment. The “0” on the x-axis represents median-effect and the “0” on the y-axis represents a 50% reduction of viable cells. The two unconnected lines show the antimicrobial effects at MIC (90% reduction) and MBC (99.9% reduction) of viable cells. The line slope represents the potency of the antimicrobial treatment(n = 3, duplicates).

