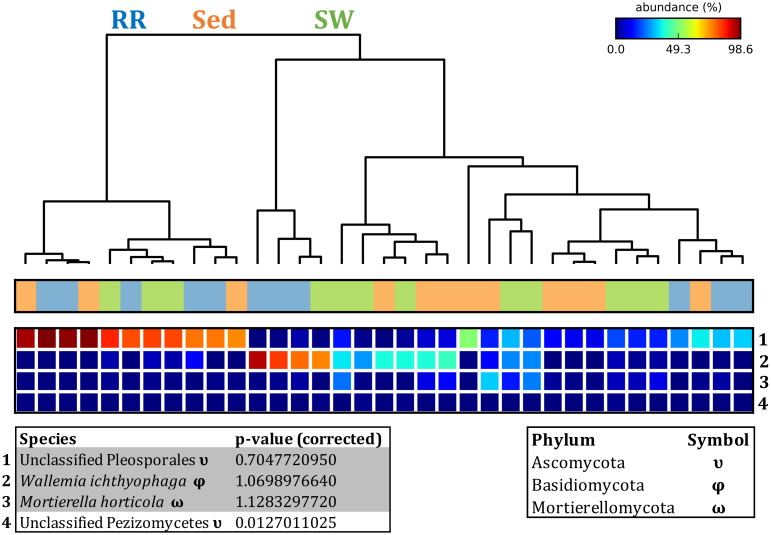
FIGURE 12.
Fungal discriminatory OTUs at the microenvironmental scale. Extensive hypothesis testing of taxonomic profiles was coupled with similarity percentages analyses (SIMPER) for fungal microbiomes across microenvironments. The proportion of sequences (mean frequency %) of OTUs significantly over-represented (Kruskal–Wallis H-test, α = 0.05, effect sizes: η2) and consistently contributing to the differences between microenvironments is indicated by varying color intensities. Corrected p-values were calculated using the Benjamini–Hochberg’s approach. Two-way crossed SIMPER analyses were performed with site and microenvironment variables as factors (S17 Bray–Curtis similarity matrix). High contributors were selected from the top-5 contributors of each pair-wise comparison between microenvironments, and those OTUs consistently accounting for the dissimilarities between any given microenvironment and the other two microenvironments were chosen as high contributors to couple with the statistical results. High contributors that were significantly over-represented were classified as discriminatory OTUs (i.e., 1–4). OTUs are sorted by decreasing mean abundance, and samples are clustered by average neighbor distance (UPGMA, distance threshold = 0.75) and colored by microenvironment. Different symbols represent the distribution of enriched phyla. High contributors that were not significantly over-represented (gray) were also classified as discriminatory OTUs if their contribution to the differences between microenvironments was consistent. RR, roots and rhizomes; Sed, sediment; SW, seawater.

