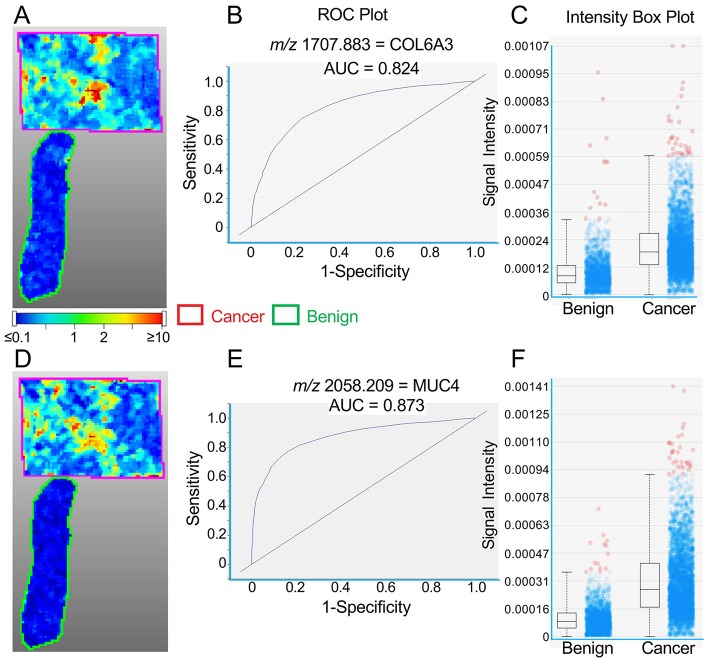
Figure 2.
Representative MALDI images for peptides representing COL6A3 (A–C) and MUC4 (D–F) in a single TNBC tissue section. (A,D) Images showing cancer tissue outlined in red and benign tissue in green. Color bar indicates relative intensity. (B,E) ROC curves showing the discrimination between cancer and benign tissue. (C,F) Intensity box plots (described in Figure 1) showing relative pixel intensities for cancer and benign tissue.

