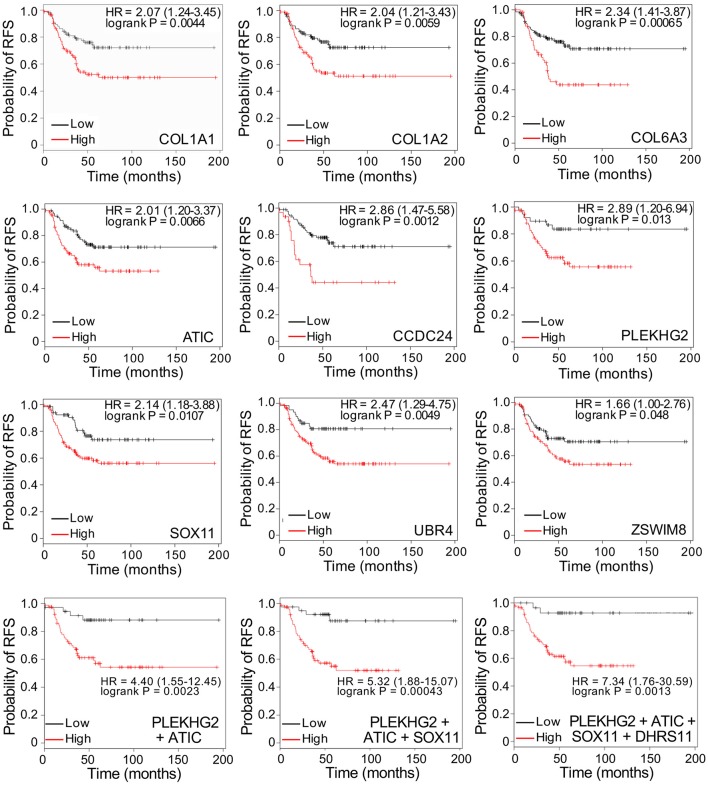
Figure 4.
Top 9 panels: Kaplan-Meier survival curves showing significant relationships between high or low gene expression of individual putative biomarkers, discovered by MALDI MS imaging, and recurrence-free survival (RFS), in women with triple-negative, basal-like breast cancer. Bottom 3 panels: Survival curves for multigene classifiers combining 2, 3, or 4 genes as indicated. Data were generated by Kaplan-Meier Plotter (kmplot.com). HR: hazard ratio. Cut-off values defining high and low expression were auto-generated.

