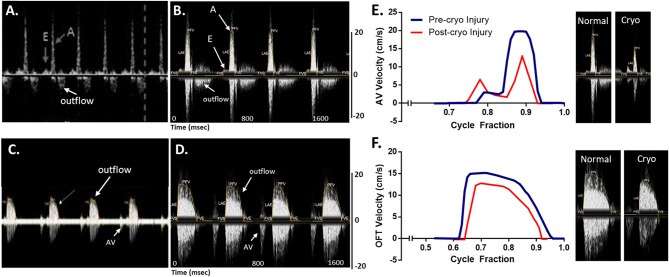
Figure 11.
Adult zebrafish blood flow velocity waveforms. (A,C) Waveforms obtained from literature (Instruments, 2017). (B,D) Waveforms obtained by the Indus mice Doppler system. (A,B) The waveforms were measured at the atrioventricular. (C,D) The waveforms were measured at the outflow track canals. Both set of data compare well, showing the same peaks with the same velocity profile. (E,F) Extracted data of blood flow velocities. Data was obtained from control and myocardial infarcted adult zebrafish at the (A) atrioventricular (AV) and (B) outflow track (OFT) canals over cycle fraction along with example waveform peaks.

