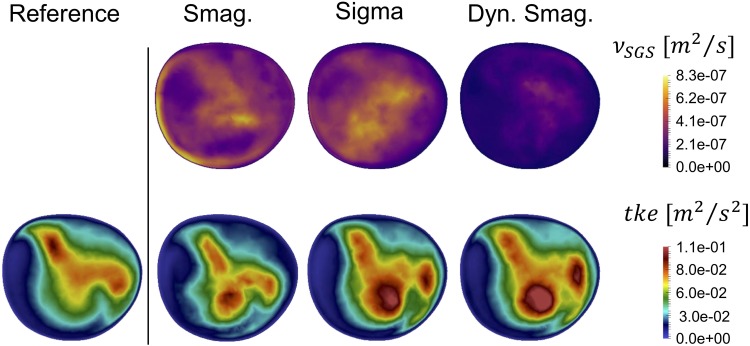
Figure 8.
Time-averaged SGS viscosity (upper panel) and resulting turbulent kinetic energy (bottom panel) for the tested SGS models and compared with the reference solution at slice C. The Smagorinsky model is phenotypically different, both in pattern and magnitude. Although more similar, the Sigma and Dynamic Smagorinsky did not produce the same patterns.

