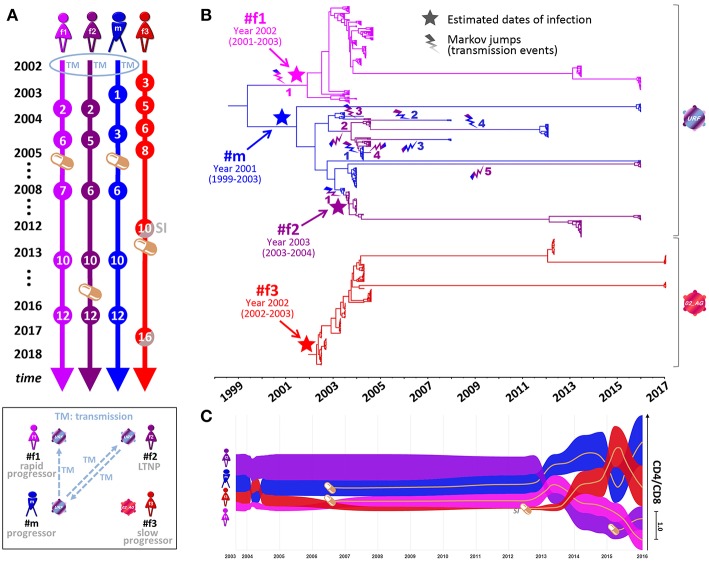
Figure 2.
Phylogenetic analysis, transmission events, and clinical parameters in four Cameroonian HIV+ individuals. (A) Timeline of essential study time points (spheres). Orange pill icons indicate time points of antiretroviral treatment initiation. TM and SI indicate the occurrence of transmission or superinfection events, respectively. (B) Temporal estimation of epidemiologically-linked transmission events and dates of infection using BEAST time-calibrated MCC trees (564 functional env sequences, 2002–2017, HIV region 6225–7817 according to HXB2 numbering). The branches of the trees are color-coded according to each individual. A color gradient along the branches and a lightning symbol (same color gradient) indicate historical transmission events among individuals. Transmission events are numbered consecutively for each recipient. The median estimated dates of infection (including 95% highest posterior density) are labeled and highlighted in the tree with a star. (C) Bump chart illustrating longitudinal CD4/CD8 ratios in the four study participants along the timeline on the X-axis modeled based on available data points. The magnitude of CD4/CD8 ratios is indicated on the Y-axis, sorted in descending order. Pill icons and brown lines indicate long-term antiretroviral treatment. BEAST, Bayesian evolutionary analysis by sampling trees; LTNP, long-term non-progressor; MCC, maximum clade credibility; URF, unique recombinant form. Inset, Schematic overview of transmission events and clinical classifications (2002–2017) of the four participants. Virus symbols indicate genetically related strains of subtypes URF (blue-purple) and CRF02_AG (red).

