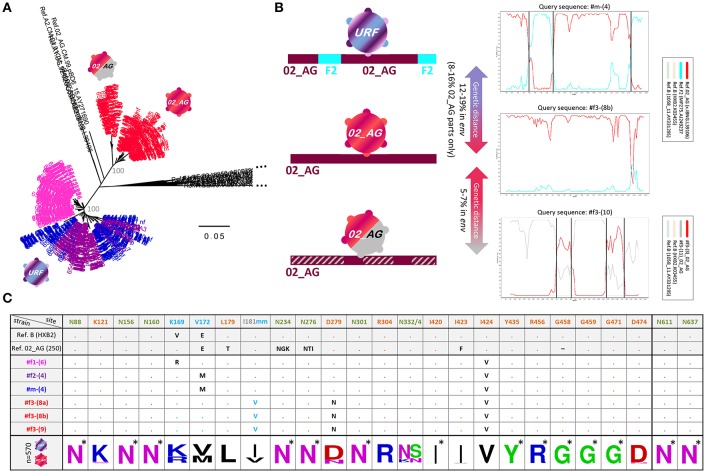
Figure 3.
Env genetic analysis in four Cameroonian HIV+ individuals. (A) Neighbor-joining phylogenetic trees (Kimura two-parameter model) displaying env sequences (HIV region 6225-7817 according to HXB2 numbering). Taxa are color-coded according to the participant (Figure 2). For each study participant, all sequences from multiple time points are displayed, i.e., ≥20 env sequences per time point (Figure 1). Bootstrap values are indicated in gray for the major branches of the participants' CRF02_AG and unique recombinant form (URF) sequences. The bar indicates a genetic distance of 5%. Reference sequences (LANL Database) are shown in black. CRF02_AG sequences of participant #f3 are separated into two populations: pre-superinfection (red icon; time points 1-9) and post superinfection (red-gray icon; time points ≥10). (B) Schematic representation of env recombination patterns in the three viral populations of the four study participants (left) as determined in Simplot bootscan analyses (right). The horizontal bar indicates the entire env genomic region; F2 parts are displayed in turquoise, CRF02_AG parts are displayed in dark red, and dashed gray indicates sequences of a genetically distant (>5%) CRF02_AG variant. Simplot Bootscan analyses were performed using representative query sequences for each virus population (indicated on top of each plot) against subtype CRF02_AG (red), F2 (turquoise) and B (light brown and green, outlier) reference sequences (boxed). The window width, step size, and bootstrap replicates were set to 200 bp, 20 bp, and 100, respectively. The Y-axis indicates bootstrap support; the X-axis indicates the env region. Recurring breakpoints supported by bootstrap values >70% are indicated as vertical black lines. The full range of genetic distances in env between viral populations is indicated (middle). (C) Env epitope analysis of six representative single genome amplified (SGA) sequences (middle), isolated from the four HIV+ individuals. At the bottom, a sequence logo analysis is shown for the entire set of studied Env sequences; asterisks indicate 100% conserved sites. Reference sequences of clade B (HXB2) and CRF02_AG (250) are shown on top. N-glycosylation sites critical for broadly neutralizing antibodies (bnAbs) are colored in olive green: N88 (gp120/gp41 interphase bnAb 35O22), N156 and N160 (V2 glycan bnAbs, e.g., PG9/PG16), N234 and N276 (gp120/gp41 interphase bnAb 8ANC195), N301 and N332/N334 (V3 glycan bnAbs, e.g., PGT121/PGT128) and N611 and N637 (gp120/gp41 interphase bnAb PGT151). Sites of immune pressure in the RV144 vaccine trial (K169, V172, and I181 mm (mismatch) in V2) are highlighted in light blue. Possible sites of resistance to CD4 binding site bnAbs are highlighted in orange. Dots indicate the presence of the above-listed amino acid residue. Black entries (or light blue in the case of I181 mm) indicate divergence from the above-listed amino acid.

