Figure 5.
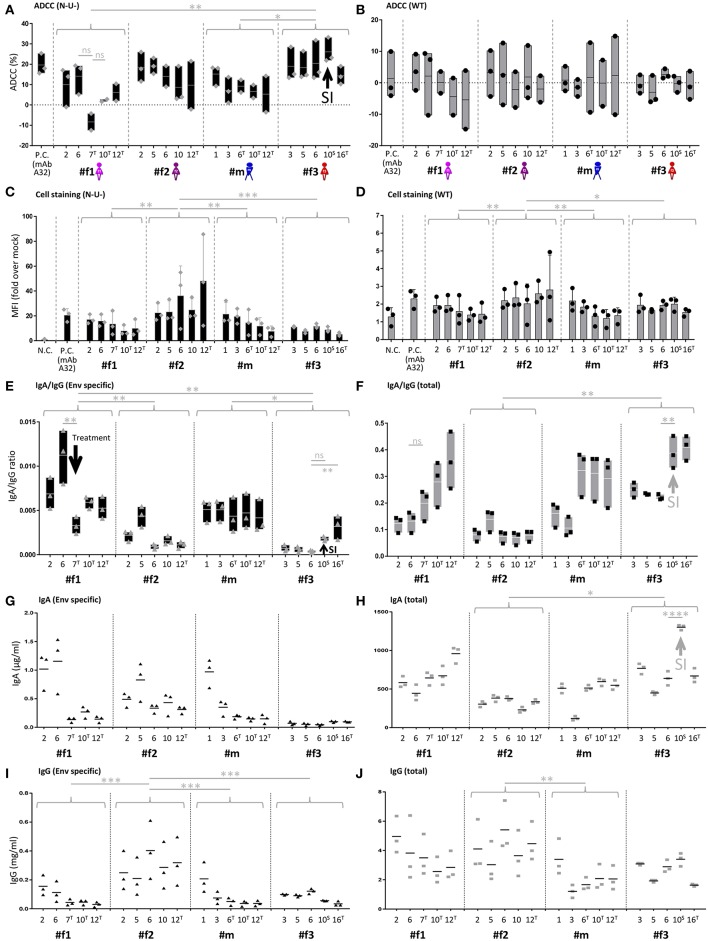
IgA/IgG levels, cell-associated Env binding and antibody-dependent cellular cytotoxicity (ADCC). (A,B) Longitudinal ADCC analysis using Nef- and Vpu-deficient (N-U-) (A) and wild-type (WT) (B) HIV-1 ADA infected CEM-NKR cells in plasma samples of the four study participants. (C,D) Longitudinal analysis of cell-associated Env binding (cell staining) using HIV-1 ADA infected CEM-NKR cells. Infection experiments were performed both with N-U- (C) and WT virus (D). (E,F) Longitudinal analysis of Env-specific (E) and total (F) IgA/IgG ratios. (G,H) Longitudinal analysis of Env-specific (G) and total (H) IgA levels. (I,J) Longitudinal analysis of Env-specific (I) and total (J) IgG levels. On the X-axis, participant IDs are listed chronologically by time point. T and S in superscript indicate time points where participants were on antiretroviral treatment or at superinfection (SI), respectively. Gray arrows indicate selected patterns of changes upon superinfection or initiation of antiretroviral treatment. MAb A32 was used as a positive control (P.C.) and mock-infected cells and/or HIV negative plasma as a negative control (N.C.). Means of two or three independent experiments performed in duplicates (IgA and IgG quantitations) or triplicates (ADCC and cell stainings) are shown. Also, floating bars (min to max) are shown in (A,B,E,F) and standard deviations in (C,D). All statistically significant differences between study participants are indicated as well as selected statistical comparisons between two-time points (One-way ANOVA, *P < 0.05; **P < 0.005; ***P < 0.0005; ****P < 0.0001; ns, not significant).

