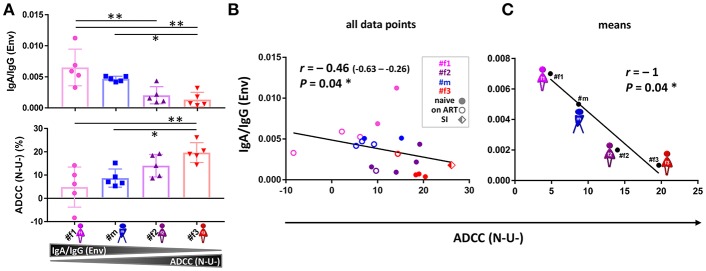
Figure 6.
ADCC and IgA/IgG patterns. (A) Scatter plot analysis of Env-specific plasma IgA/IgG ratios (top) and ADCC (N-U-)(bottom) against HIV-1 ADA-infected CEM-NKR cells. Mean and standard deviation for the five longitudinal values per participant are shown. All statistically significant differences among participants are indicated (one-way ANOVA, *P < 0.05; **P < 0.005). (B,C) Correlation analysis between ADCC (N-U-) and Env-specific plasma IgA/IgG ratios using all data points (B) and means per participant and parameter (C). Correlation coefficients r (with 95% confidence intervals if applicable) and P-values are indicated using non-parametric Spearman rank. Asterisks indicate statistically significant correlations in a two-tailed (B) or one-tailed Spearman rank test (means) (C) (*P < 0.05). ADCC, antibody-dependent cellular cytotoxicity; ART, antiretroviral treatment; N-U-, Nef- and Vpu-deficient.

