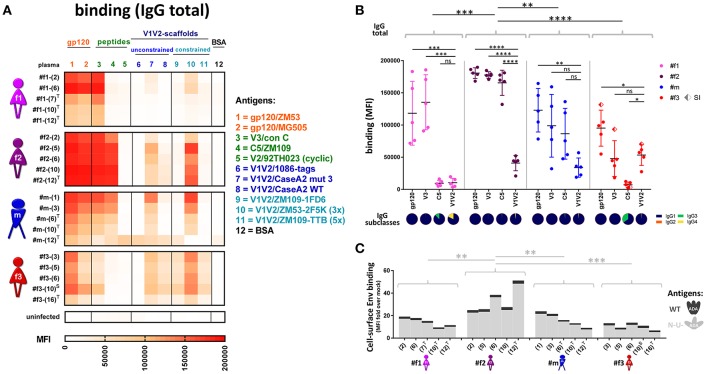
Figure 7.
Antibody binding profiles of study participants. (A) Heatmap of longitudinal total IgG antibody binding levels, determined by a multiplex bead assay (Luminex) using plasma diluted 1:200 against a set of eleven Env antigens. Antigen #10 is trimeric (3x), and #11 is pentameric (5x). BSA coated beads and plasma from an uninfected, healthy Cameroonian individual were used as negative controls. T: antiretroviral treatment; S: superinfection. (B) Quantitative scatter plot analysis of total IgG levels against gp120, V3, C5, and V1V2. For gp120 and V1V2, the average binding levels of two gp120 proteins or six scaffolded V1V2 proteins (see A) are shown, respectively. The dots represent the different time points per participant for the corresponding antigen; SI: superinfection. All statistically significant differences (one-way ANOVA) in overall binding levels among individuals are indicated, as well as statistical analyses comparing the binding of every antigen against V1V2 within each individual. IgG subclass composition (IgG1-4) of plasma binding to the four selected Env antigens (averaged longitudinal values) are shown as pie charts according to the indicated color-code. (C) Cell-surface staining of CEM-NKR cells infected with a virus encoding ADA wild-type (WT, dark gray, top) or Nef-, Vpu-deficient (N-U-, light gray, bottom) virus. Staining of native Env was done using longitudinal plasma samples (time points in brackets) and is displayed in stacked bar graphs with means of at least two repetitive experiments. Statistical analysis was performed for the N-U- data set using one-way ANOVA. *P < 0.05; **P < 0.005; ***P < 0.0005; ****P < 0.0001; ns, non-significant.

