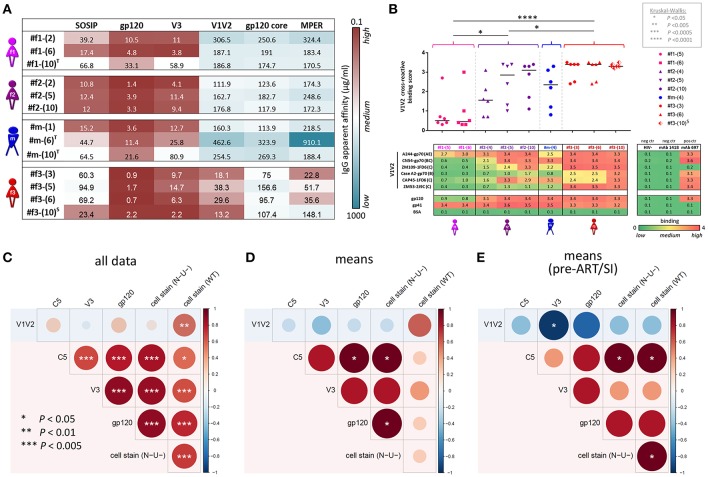
Figure 8.
IgG apparent affinities, ELISA plasma binding levels, and binding correlation analysis. (A) Heatmap of half-maximum binding concentrations (EC50, μg/mL) determined by ELISA using plasma-purified IgG (range of 0.2–500 μg/mL) from longitudinal time points (shown in parentheses). A set of six Env antigens was used: trimeric SOSIP/BG505, gp120/JRFL, cyclic V3/ZM109 peptide, constrained V1V2/ZM109-1FD6 scaffold, gp120 core/JRFL, and MPER gp41/con B peptide. T and S in superscript indicate time points where participants were on antiretroviral treatment or at superinfection, respectively. (B) Plasma samples diluted 1:100 were tested against six different V1V2 constructs: V1V2-gp70 fusion proteins A244 (clade AE), CN54 (clade B/C), and CaseA2 (clade B), V1V2-1FD6 fusion proteins ZM109 and CAP45 (both clade C), as well as trimeric V1V2-2J9C fusion protein ZM53 (clade C). Antigens gp120 MN (clade B) and gp41 MN (clade B), as well as anti-V2 mAb 697-D, were used as positive controls; BSA, plasma of a healthy HIV− Cameroonian individual and anti-parvovirus B19 mAb 1418 were used as negative controls. A heat map of binding levels is shown at the bottom. The V1V2 binding responses are summarized for each time point sample to a V1V2 cross-reactive binding score, shown on top. V1V2 cross-reactive binding scores were statistically compared between participants using one-way ANOVA; asterisks indicate statistically significant differences according to the boxed P-value scheme. Bi-colored diamonds as symbols indicate the time point when superinfection (S in superscript) was detected in #f3. (C–E) Correlation analysis between Luminex V1V2, V3, C5, gp120, and cell-associated Env binding levels. Linear regression analysis was performed for the following data sets: all individual data points of the four participants (C), binding means per participant and antigen (D) and means per participant/antigen from time points pre-ART and pre-superinfection (E). Correlograms are shown, sized and color-coded according to the correlation coefficient (r). Asterisks indicate all correlations that reached statistical significance in a two-tailed Spearman rank test (C) or one-tailed Spearman rank test for the means (D,E) according to the provided P-value scheme (on the left). Red background indicates the presence of a positive correlation pattern; the blue background indicates the tendency of an overall inverse or absence of correlation pattern. ART, antiretroviral treatment.

