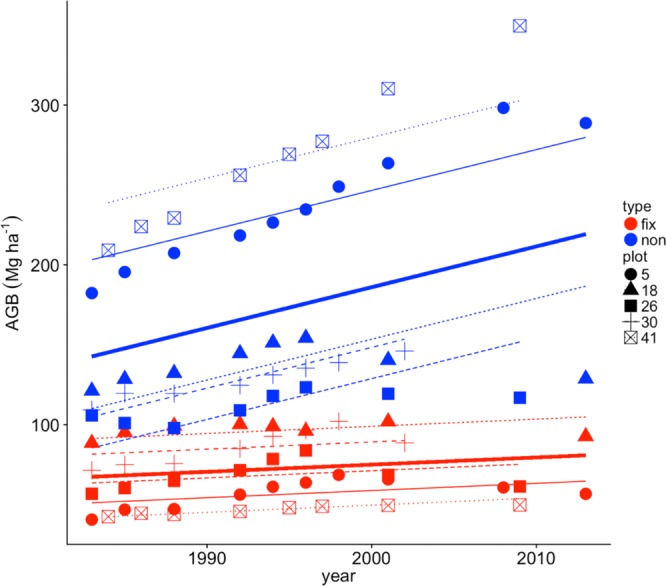
Figure 1.

Aboveground biomass (AGB) for the five 1-ha stem inventory plots in the VMFR over time. Red points and lines are N-fixers and blue points and lines are non-fixers. Thick red and blue lines show the average change in AGB across plots, while thin lines and different symbols represent individual plots. All slopes are fixed effects from a linear mixed effects model with a significant interaction between tree type (“type”) and time and a random effect of tree type nested within plot. Plots were either old-growth and never cut (Plot 41) or selectively harvested in years 1981 (Plot 5), 2000 (Plot 18), 2005 (Plot 26) or 2012 (Plot 30).
