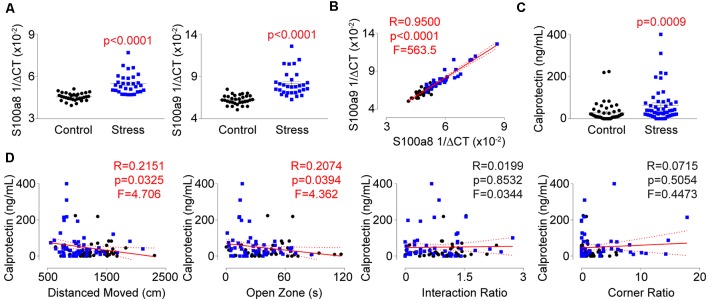
Figure 7.
Identification of calprotectin as a novel marker of psychological trauma. Plasma, whole spleens, and purified splenic T-lymphocytes were isolated following the social defeat paradigm. (A) Quantitative real-time RT-PCR analysis of S100a8 and S100a9 mRNA levels within splenic T-lymphocytes. Data are shown as 1/ΔCT as normalized by 18s rRNA loading control. S100a8 (N = 32 controls, 31 stress; 2-tailed; Mann-Whitney U = 58.0), S100a9 (N = 32 controls, 31 stress; 2-tailed; Mann-Whitney U = 47.5). (B) Correlation of splenic T-lymphocyte levels of S100a8 and S100a9 mRNA levels. (N = 32 controls, 31 stress. DFn, Dfd = 1,61). Statistics obtained using linear regression with Pearson correlation coefficient calculations (red line; 95% confidence interval indicated as dotted red line). (C) Circulating calprotectin levels assessed by ELISA. (N = 50 controls, 52 stress; 2-tailed, Mann-Whitney U = 756). (D) Correlation of circulating calprotectin levels with anxiety-like and depression-like behavior indices. (N = 50 controls, 52 stress. DFn, Dfd = 1,100 for all). Black circles indicate control animals; blue squares indicate socially-defeated (Stress) animals. Statistics obtained using linear regression with Pearson correlation coefficient calculations (red line; 95% confidence interval indicated as dotted red line). Values highlighted in red demonstrate statistical significance.

