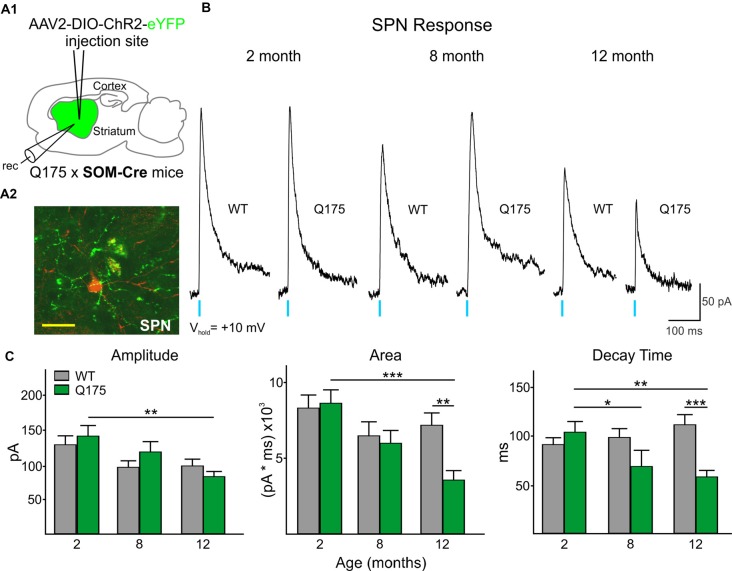
Figure 3.
Optical activation of SOM-expressing interneurons in Q175 and WT mice at three ages. (A1) Schematic of AAV injection site and recording area in Q175xSOM-Cre mice. (A2) Confocal z-stack image of a biocytin-filled SPN (red) that was recorded from a 12 month-old Q175xSom-Cre mouse. SOM-expressing interneuron processes expressing ChR2-eYFP are seen surrounding the recorded cell. Scale bar = 20 μm. (B) Sample traces of evoked GABAergic responses in WT and Q175 SPNs following optical activation of SOM-expressing interneurons. (C) Summary of optically-evoked γ-aminobutyric acid (GABA) response properties in WT and Q175 SPNs at 2 (WT n = 26, 11 mice; Q175 n = 27, 10 mice), 8 (WT n = 18, seven mice; Q175, n = 17, nine mice) and 12 months (WT n = 30, 13 mice; Q175, n = 34, nine mice). Significant differences were determined using Two-way ANOVAs and appropriate post hoc analyses, where *p < 0.05, **p < 0.01 and ***p < 0.001.

