
FIGURE 2.
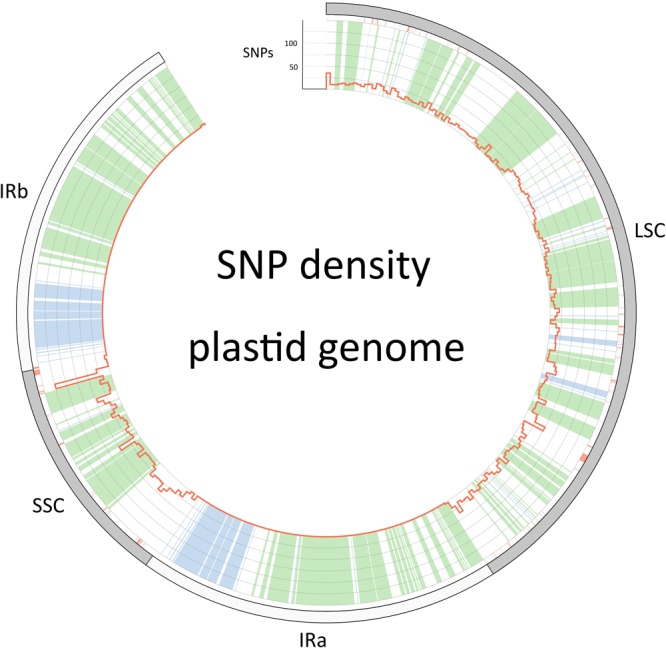
Single nucleotide polymorphism density along the plastid genome (red histograms). The outer circle describes the boundaries of the large single copy, the inverted repeats (IRa and IRb) and the small single copy. Regions that are colored green in the inner circle are coding regions, blue are RNA genes (rRNA and tRNA genes) and white is non-coding sequence. Red color below the outer circle shows regions that have been masked and are thus coded as “N”.