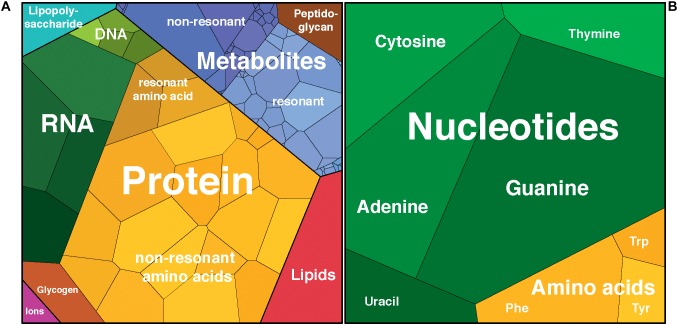
Figure 1.
Schematic representation of (A) cell components by dry mass and (B) integrated Raman intensities from deconvolution of the Escherichia coli Raman spectrum using nucleotide and amino acid spectra. Proportional visualization using Voronoi diagrams with the area of each cell representing the relative contribution of that component to the total. Plots rendered using Proteomaps http://bionic-vis.biologie.uni-greifswald.de/ (Bernhardt et al., 2009; Otto et al., 2010; Liebermeister et al., 2014).

