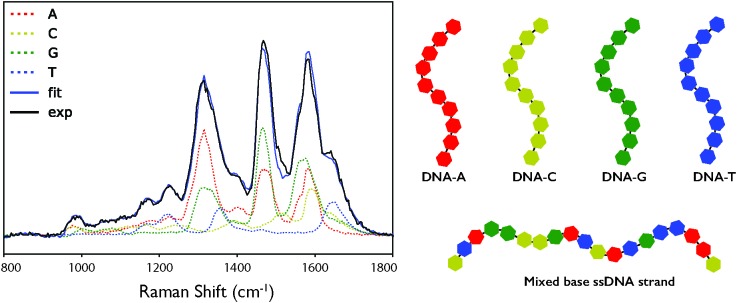
Figure 4.
(A) Deconvolution of the DUV Raman spectrum for a single-stranded DNA sequence (5′-CAATTGTACTAGCCGGATC-3′) using the individual DNA and amino acid spectra. Exp: the calibrated mean experimental data. Fit: the fit result of the linear combination of components. (B) Schematic representation of the mononucleotide and mixed based ssDNA strands used as standards.

