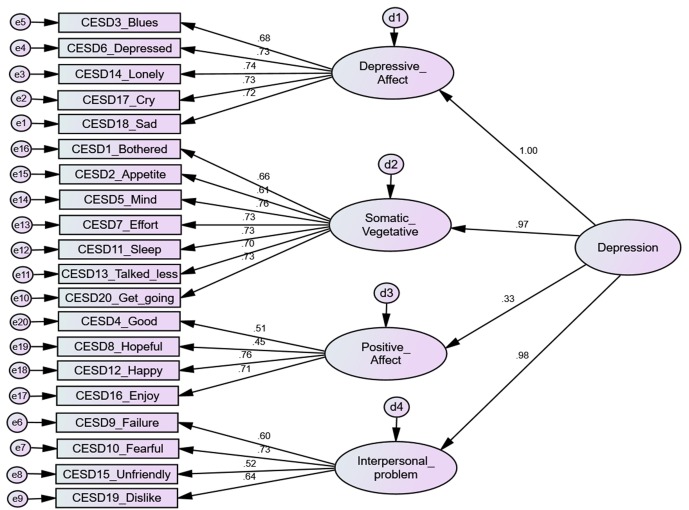
Figure 2.
Four factors with second-order single common factor model of CES-D (Sheehan’s item allocation, uncorrelated error terms). Rectangles represent indicator items; ovals represent latent factors; single-headed arrows along with standardised weights represent factor and item loadings; circles represent error terms for each item (e) and disturbance terms of each latent factor (d). Model fit: χ2=709.251; df=166; X2/df=4.273; CFI=0.894; TLI=0.879; RMSEA=0.076; SRMR=0.0508. CES-D, Center for Epidemiologic Studies Depression Scale; CFI, Comparative Fit Index; RMSEA, root mean square error of approximation; SRMR, standardised root mean residual; TLI, Tucker-Lewis Index.

