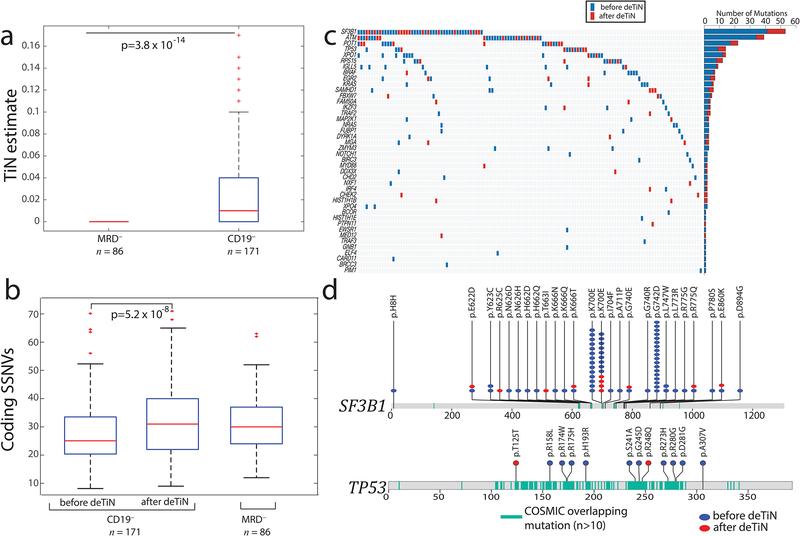
Figure 2. Application of deTiN to chronic lymphocytic leukemia (CLL) sequencing data.
(a) TiN estimates for CD19– selected (normal) blood compared with whole blood from minimal residual disease negative (MRD–) patients. Box plot: median TiN value (red line), box represents Q1 and Q3 quartiles, whiskers represent the most extreme data points that are not outliers. Outliers are denoted with red crosses and represent data points out side the range [Q1 - 1.5 IQR, Q3 + 1.5 IQR] where IQR is the interquartile range. P value is calculated using two-tailed Mann–Whitney test (n=257 independent patient samples). (b) Mutation rate in samples pre- and post-application of deTiN stratified by normal sample type. Box plot and P value as in panel a. (c) Heat map and bar plot illustrating recovery of SSNVs in the CLL cohort. Samples are in columns, genes in rows. Blue boxes indicate variants detected prior to deTiN (“without deTiN”); red boxes indicate additional variants recovered by deTiN (“with deTiN”). (d) Stick plots showing mutation data in SF3B1 and TP53. Amino acid positions of recurrent COSMIC mutations are highlighted in teal. Blue circles indicate variants detected prior to deTiN; red circles indicate variants recovered by deTiN.

