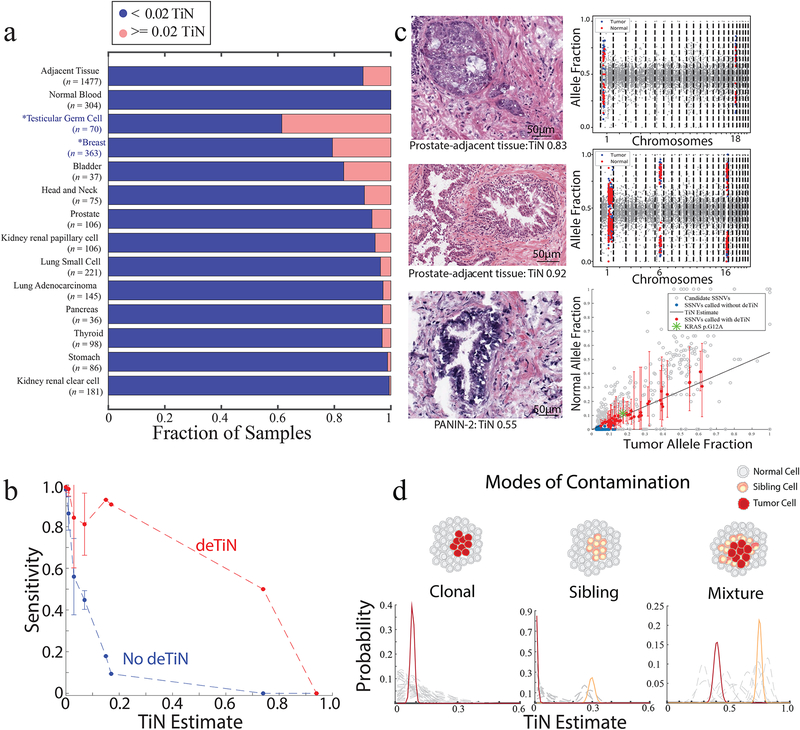
Figure 3. Application of deTiN to analysis of solid tumors with adjacent normal controls.
(a) Fraction of contaminated samples (pink; TiN≥0.02) when using different sources for normal tissue (tumor-adjacent normal tissue and peripheral blood) and, in cases with tumor-adjacent normal, stratified by tumor type. Asterisks represent non-TCGA cohorts. (b) Points show mean sensitivity for detecting mutations with deTiN (red) and without deTiN (blue). Means were derived from 256 of the 304 tumors that were matched with both a tumor-adjacent and a blood normal sample and had a sufficient number of somatic events to robustly estimate TiN (TiN = 0 [n=230]; TiN=0.01 [n=9]; TiN = 0.03 [n=9]; TiN=0.07 [n=4]; TiN=0.15 [n=1]; TiN=0.17 [n=1]; TiN=0.74 [n=1]; TiN=0.94 [n=1]). Error bars indicate standard error. (c) Histology images of selected adjacent tissue samples with evidence supporting TiN (n=1 patient sample for each image and plot). deTiN aSCNA data supporting TiN estimate is displayed for top two samples; points indicate allele-fraction of heterozygous germline SNPs, blue (tumor) and red (normal) points are used for TiN estimation, and grey points are not used by deTiN. The bottom plot displays deTiN somatic variant data supporting the TiN estimate for the bottom sample. Points indicate allele-fraction of variants in the tumor (x-axis) and normal (y-axis) samples; error bars indicate 95% beta confidence intervals. The green asterisk represents the KRAS G12V mutation, red points represent SSNVs recovered by deTiN, blue points are called before deTiN, and grey points are rejected by deTiN and MuTect as germline or artifact. Each plot displays data supporting TiN from a single tumor-normal pair corresponding to the image on the left (n = 1). (d) Illustration of three modes of contamination. Posterior distribution functions for TiN based on aSCNA data are shown clustered (red and orange) and unclustered for individual events (dashed grey). In the mixture scenario, TiN has two possible values: the lower represents events unique to the tumor cells (red) and the higher represents events shared between the tumor cells and the sibling precursor cells (orange).

