
Figure 5.
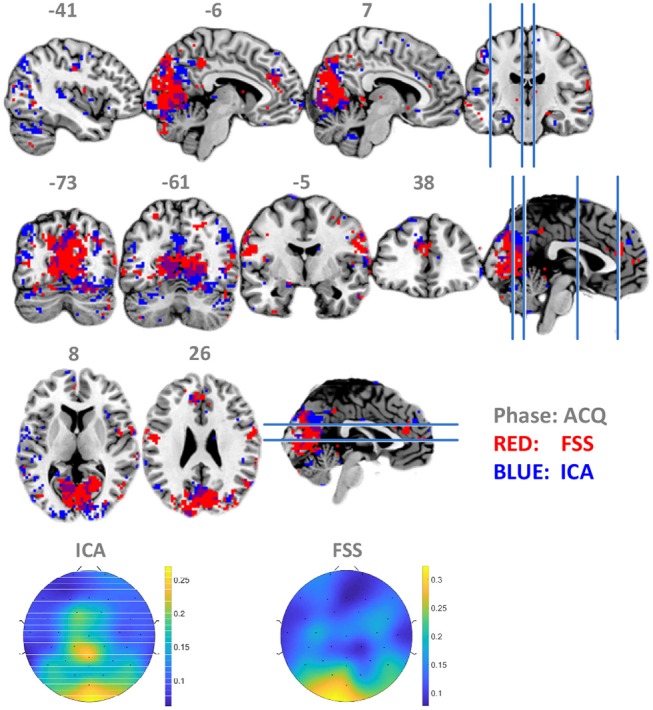
Maps of binomial test result for FSS-ssVEP and BOLD (red) in contrast to the ICA-ssVEP and BOLD (blue), acquisition phase (ACQ). The scalp topographical distribution of FSS weights are compared with ICA.
Official websites use .gov
A
.gov website belongs to an official
government organization in the United States.
Secure .gov websites use HTTPS
A lock (
) or https:// means you've safely
connected to the .gov website. Share sensitive
information only on official, secure websites.
Maps of binomial test result for FSS-ssVEP and BOLD (red) in contrast to the ICA-ssVEP and BOLD (blue), acquisition phase (ACQ). The scalp topographical distribution of FSS weights are compared with ICA.