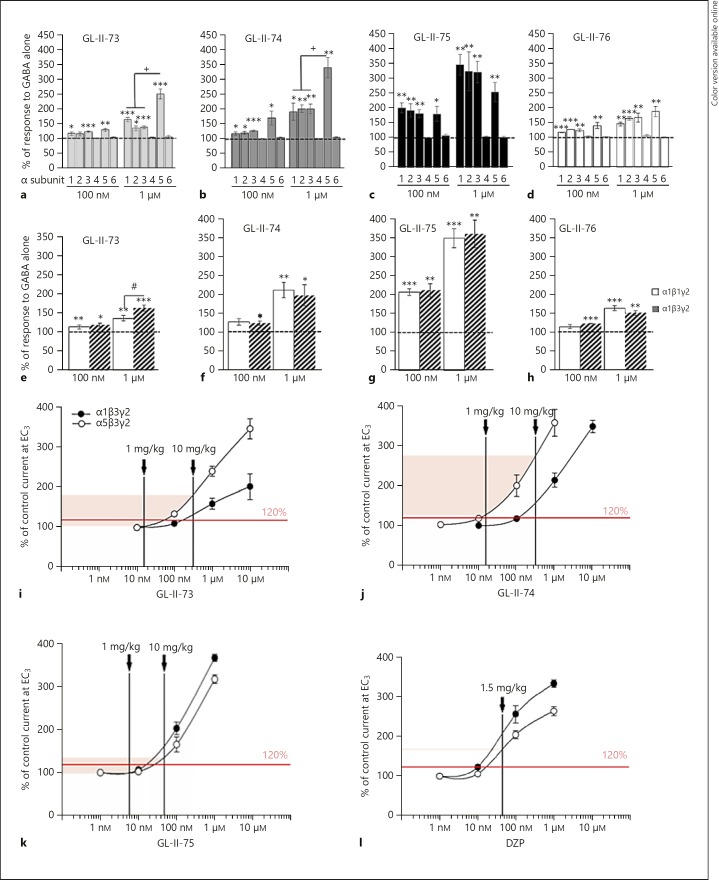
Fig. 1.
Electrophysiological recordings at GABA-A receptors. Modulation properties of 100 nM or 1 µM of GL-II-73 (a, e), GL-II-74 (b, f), GL-II-75 (c, g), or GL-II-76 (d, h) at recombinant α1/2/3/4/5/6β3γ2 (a–d) or α1β1/3γ2 (e–h) receptors. The potentiation of GABA alone (EC3–5 GABA) is expressed in percentage. * p < 0.05, ** p < 0.01, and *** p < 0.001 compared to 100%; + p < 0.05 compared to α5β3γ2; # p < 0.05 compared to α1β3γ2. The approximated electrophysiological responses elicited by the estimated free brain concentrations and presented on the concentration-response curves of GL-II-73 (i), GL-II-74 (j), GL-II-75 (k), and DZP (l) at rat recombinant α1β3γ2 and α5β3γ2 GABA-A receptors measured at GABA EC3 (eliciting 3% of the maximal GABA current in the respective subtype). Brain tissue density of 1.04 g/mL was used to convert brain concentrations from ng/g into ng/mL. The shaded range delineates the interpolated lower and upper limit of potentiation at α5-GABA-A receptors in the dose range used; the vertical lines mark the approximated free brain concentration of the given dose of each ligand. The level of potentiation of 120% was arbitrarily set as borderline for eliciting in vivo behavioral effects.

