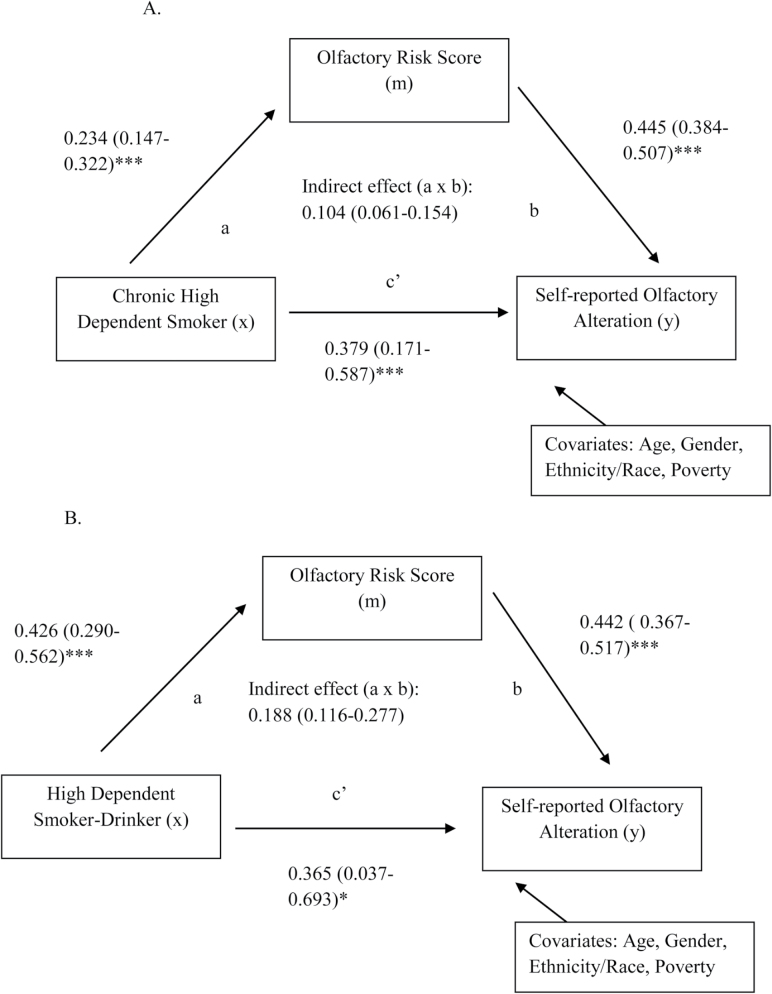
Figure 2.
Models of the association between (A) chronic high dependent smoking or (B) high dependent smoking-drinking and self-reported olfactory alterations mediated by olfactory risk score in data from the National Health and Nutrition Examination Survey 2011–2014. The a paths represent the relationship between x and m, and the b paths represent the relationship m and y. The product of path a and b represents the indirect effect of chronic dependent smoking or dependent smoking-drinking on olfactory alteration; the c’ path represents the direct effect on olfactory alteration. Results displayed for each path include regression coefficient estimates (95% confidence intervals). *p ≤ .05, **p ≤ .01, ***p ≤ .001.

