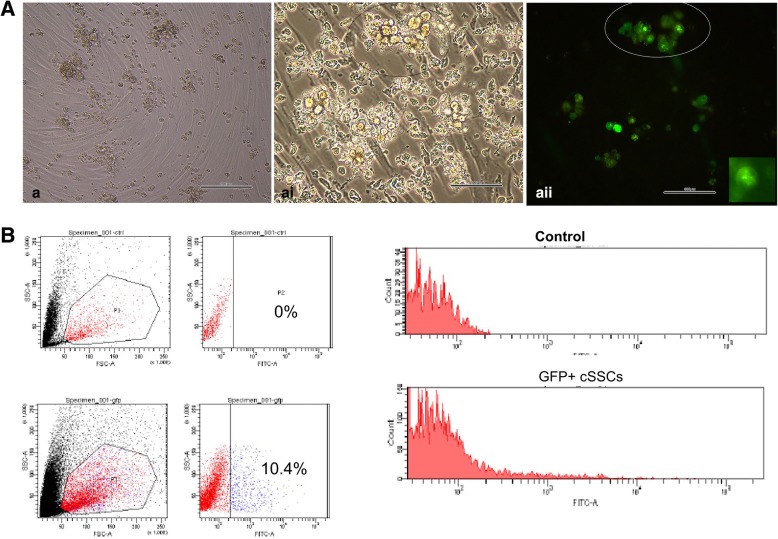
Fig. 3.
Flow cytometric and fluorescence analysis of cSSCs. a–ai GFP+ cSSCs appear as isolated cells or form germ cell clumps (circle). aii Fluorescence analysis of cSSCs showing GFP positivity after transduction (circle). B Flow cytometry was used to evaluate the efficiency rate of the transduction of cSSCs with GFP compared with the control group. The control group (histogram) was GFP negative. The histogram shows that in the treated group, only 10.4% of the cSSC population was GFP+. (Scale bar = 100 μm)

