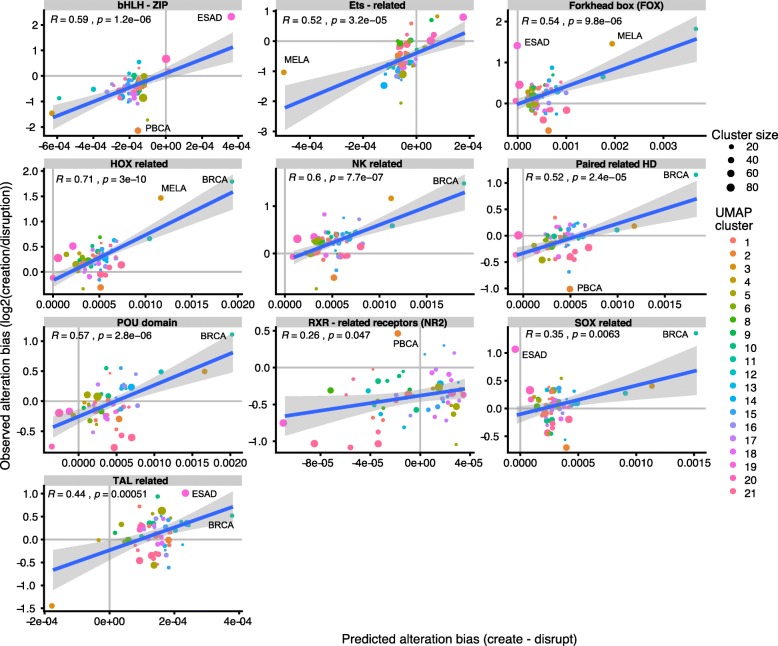
Fig. 8.
Comparison of the predicted differential alteration (creation minus disruption) (x-axis) with the observed log-ratio of motif creation counts versus the disruption counts, obtained from the SNV in each tumor subtype. Correlation coefficient and p-values for the regression are indicated in the maps. Color dots represent samples belonging to a tumor subtype and a UMAP cluster. Some interesting sample groups are indicated explicitely

