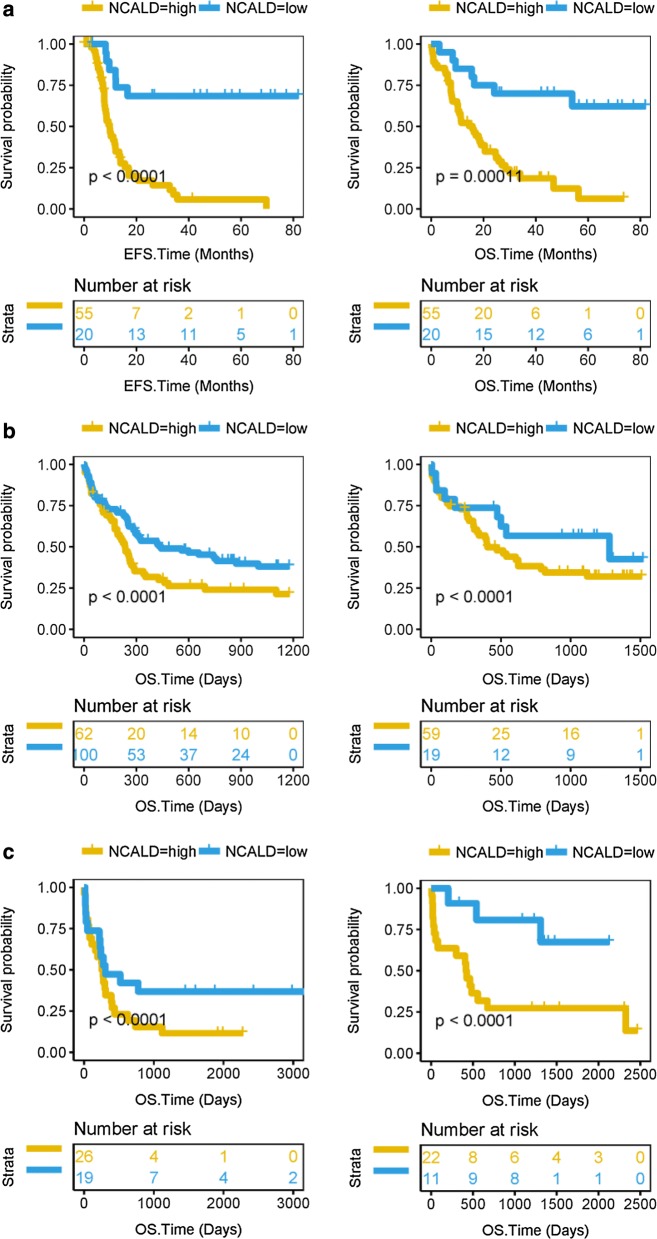
Fig. 1.
High NCALD expression predicts worse survival of CN-AML. The X axis represents time and the Y axis represents survival probability. A, Kaplan–Meier curves were used for EFS and OS in different NCALD expression groups of CN-AML in the TCGA dataset. The cutoff value for the high and low NCALD groups was 4.74. EFS, P < 0.0001; OS, P = 0.00011; log rank test. B, Kaplan–Meier curves were used for OS in different NCALD expression groups of CN-AML in GSE12417. The cutoff values for the high and low NCALD groups were 8.1794 (left)/5.882 (right). OS, P < 0.0001; log rank test. C, Kaplan–Meier curves were used for OS in different NCALD expression groups in GSE22778. The cutoff values for the high and low NCALD groups were − 1.384 (left)/− 1.095 (right). OS, P < 0.0001; log rank test

