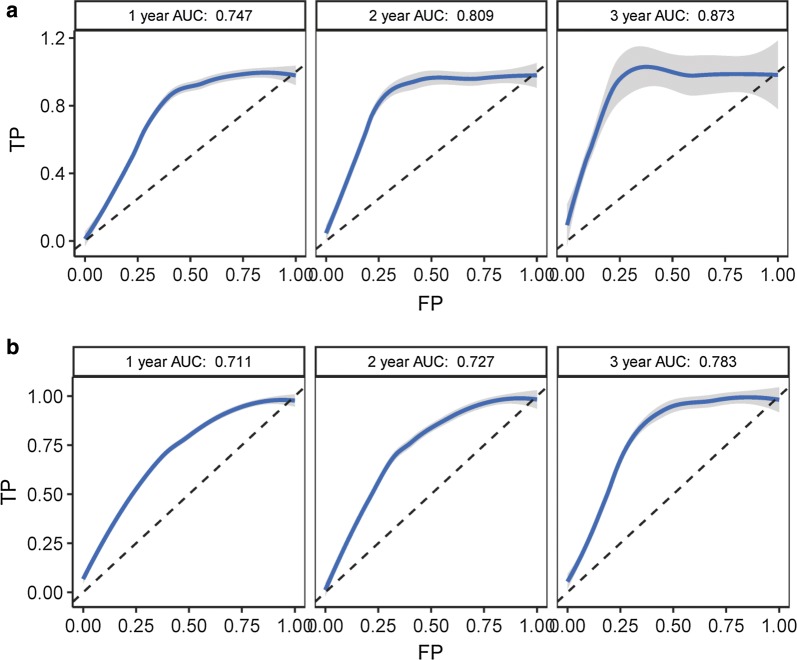
Fig. 3.
ROC curves of survival for NCALD gene expression in TCGA CN-AML patients. The X axis represents false positive (FP) and the Y axis represents true positive (TP). A, ROC curves for NCALD expression and EFS of 75 TCGA CN-AML patients were performed. AUC reached 0.747 (1 year survival, left panel), 0.809 (2 year survival, middle panel) and 0.873 (3 year survival, right panel) respectively. B, ROC curves for NCALD expression and OS of 75 TCGA CN-AML patients were performed. AUC reached 0.711 (1 year survival, left panel), 0.727 (2 year survival, middle panel) and 0.783 (3 year survival, right panel) respectively. The grey shadow of the curves represents 95% confidence interval

