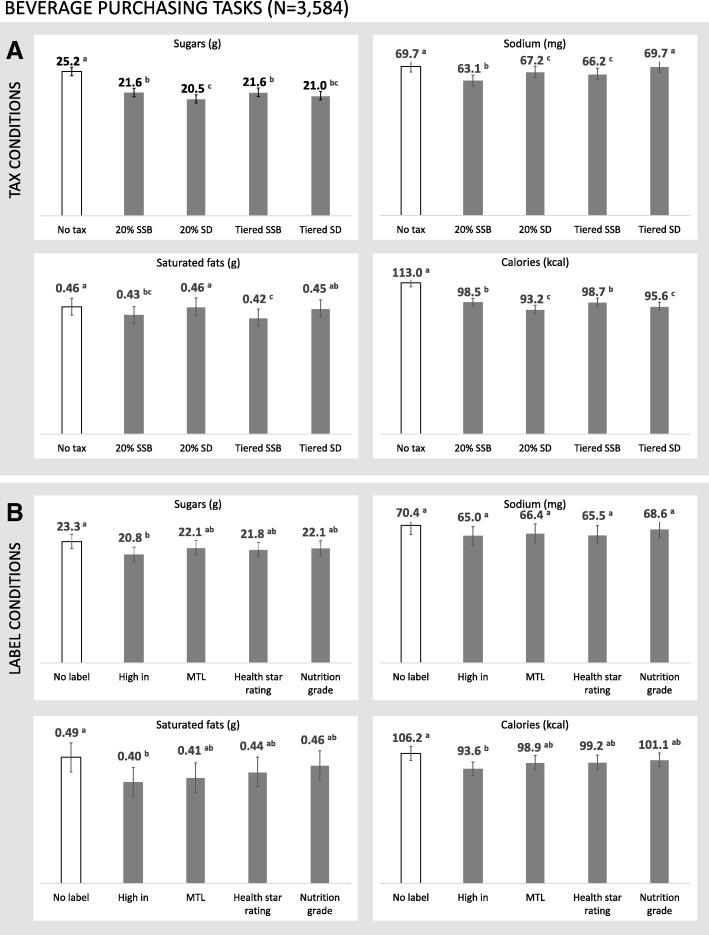
Fig. 3.
Sugars, sodium, saturated fats, and calories in purchased beverages within an experimental marketplace in which (a) tax conditions and (b) FOP label conditions varied. Error bars represent 95% confidence intervals for the mean estimates. a,b,c Values with differing superscript letters indicate tests for which p < .05 in a repeated-measures ANOVA

