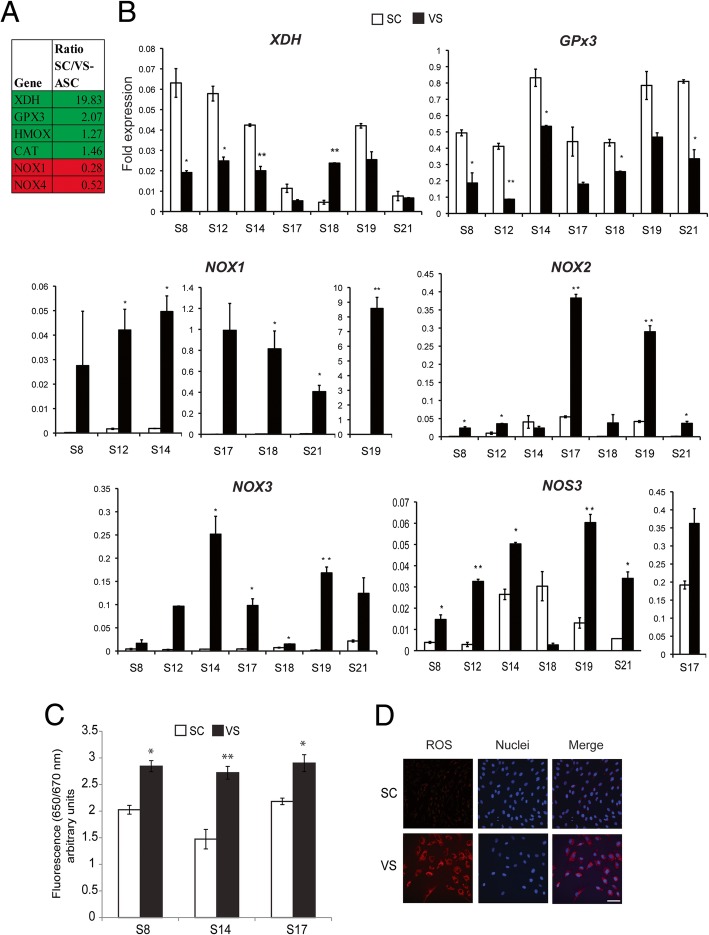
Fig. 1.
VS-ASCs have increased ROS when compared to SC-ASCs. a Table showing fold expression of genes differentially expressed in SC- vs. VS-ASCs from the microarray data. b Graphs showing fold expression of oxidative stress-related genes XDH, GPx3, NOX1, NOX2, NOX3, and NOS3 each in triplicates in SC- and VS-ASCs from seven subjects. Similar results were obtained from other subjects. Statistical significance was calculated by ANOVA. *p < 0.05, **p < 0.01, and ***p < 0.001 when compared to SC. c Graph showing fluorescence intensity of SC- and VS-ASCs (p8) each in triplicates from three representative subjects when stained with CellROX™ Deep Red Reagent. Statistical significance was calculated by ANOVA. *p < 0.05 and **p < 0.01 when compared to SC. d Representative images (× 40) showing fluorescence staining of ROS (red) and nuclei (blue) in S17 SC- and VS-ASCs when stained with CellROX™ and Hoechst 33342, respectively. Scale bar represents 100 μm

