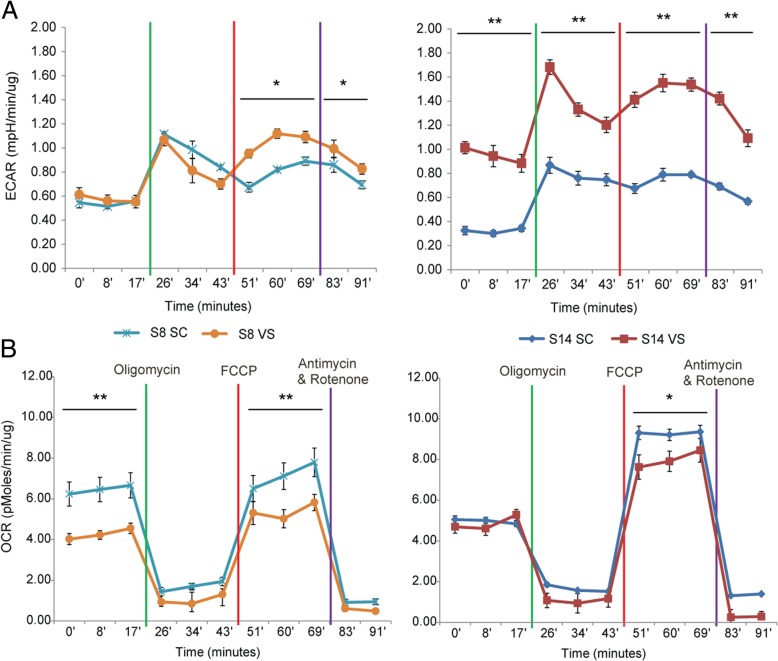
Fig. 2.
ASCs exhibit depot-specific differences in mitochondrial respiration and glycolysis. a Graph showing ECAR (extracellular acidification rate) by Seahorse XF analyses each in triplicates for SC- and VS-ASCs from two representative subjects (S8 and S14). b Graph showing OCR (oxygen consumption rate) by Seahorse XF analyses each in triplicates for SC- and VS-ASCs from two subjects. Statistical significance was calculated by ANOVA. *p < 0.05, **p < 0.01

