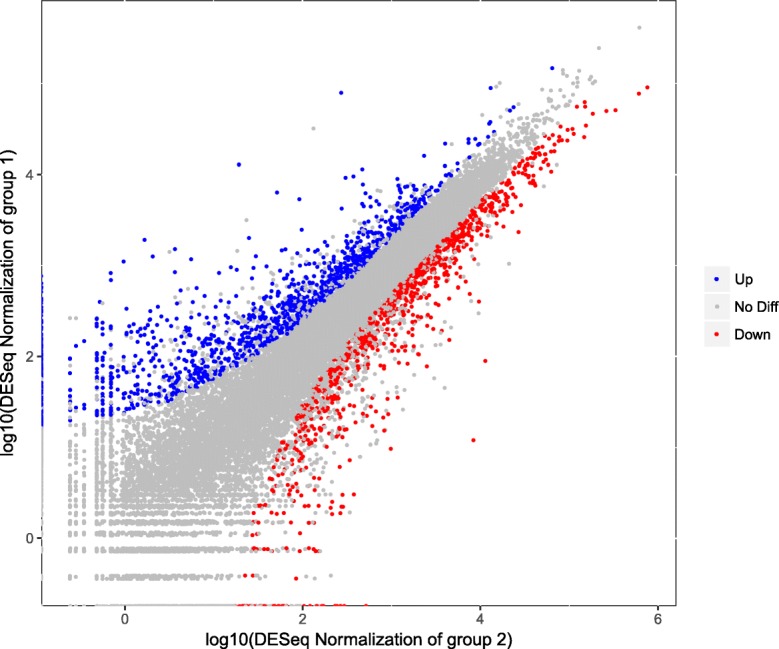
Fig. 6.

Fall dormant (FDT)-VS-non-dormant (NDT) differentially expressed genes (DEGs). DEGs were filtered using false discovery rate (FDR) ≤ 0.001 and |Log2Fold-Change| ≥ 2 as thresholds. The group 1 represents FDT alfalfa cultivar, and group 2 represents NDT alfalfa cultivar. The blue, red and gray spots represent the up-regulated, down-regulated DEGs and genes without obvious changes in FDT and NDT alfalfa cultivars under cold acclimation, respectively
