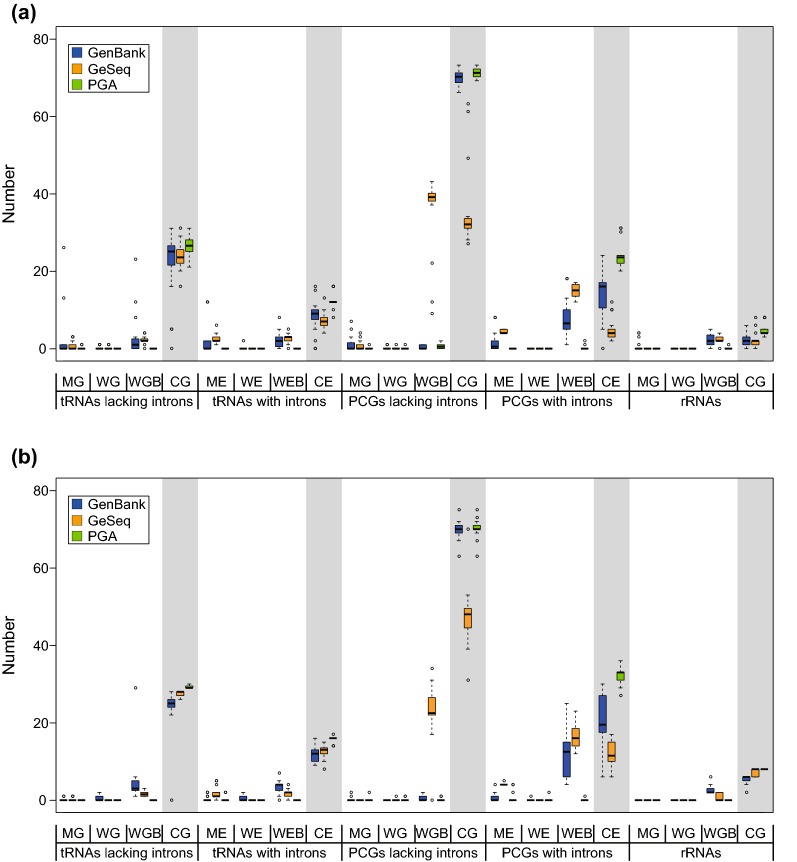
Fig. 5.
Boxplots comparing the performance of PGA and GeSeq. a Performance of PGA relative to GeSeq using the properly annotated Zamia furfuracea plastome as a reference. b Performance of PGA relative to GeSeq using the properly annotated Amborella trichopoda plastome as a reference. Thick lines within boxes are medians, the top and bottom of each box are quartile lines, and circles depict outliers. MG = missing annotated gene, WG = wrongly annotated gene, WGB = wrongly annotated gene boundary, CG = correctly annotated gene. ME = missing annotated exon, WE = wrongly annotated exon, WEB = wrongly annotated exon boundary, CE = correctly annotated exon

