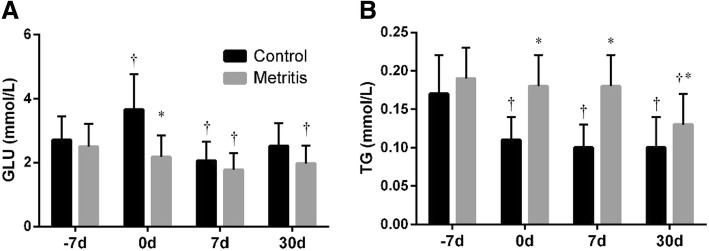
Fig. 3.
Summed changes (mean ± SD) in (a) glucose (GLU) and (b) triglyceride (TG) levels in serum of cows with metritis (n = 28) and control cows (n = 28) at 7 days before the estimated parturition (− 7 d), the day of parturition (0 d), and 7 and 30 d postpartum. Asterisks (*) indicates statisticallty significant (p < 0.05) difference between the control and the metritis group at the same time point. Crosses (†) indicates statistically significant (p < 0.05) difference when compared to − 7 d within the same group

