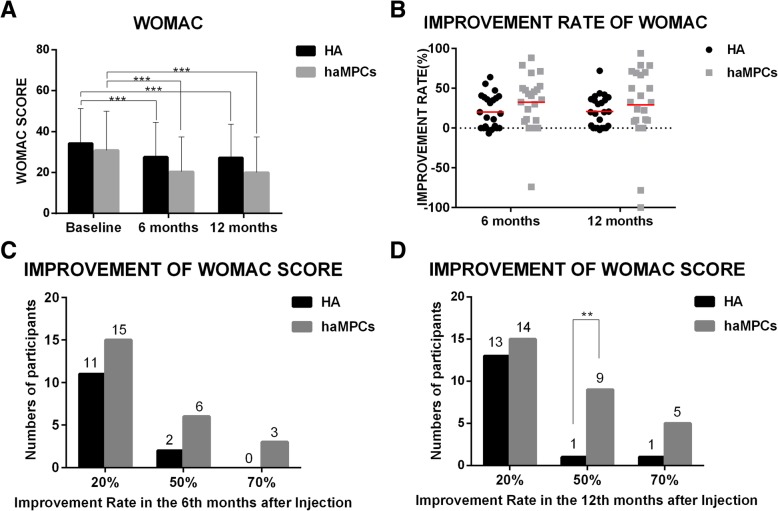
Fig. 2.
Changes of WOMAC score during 12 months after intra-articular injection of Re-Join® and HA. a Score and mean improvement rate of WOMAC, VAS, and SF-36 in the Re-Join® and HA groups at baseline and 6 months and 12 months after injection. b Mean improvement rate of WOMAC score compared with baseline in the Re-Join® and HA groups at baseline and 6 months and 12 months after injection. Statistics were determined by t test in a and b. c, d Number of patients who reached an improvement rate of 20%, 50%, and 70% according to the WOMAC score in 6 months (c) and 12 months (d) after injection compared with baseline. Score was shown in mean and standard deviation. Mean improvement rate was shown as the percentage of change of score in each time point of follow-up compared with baseline. Statistics were determined by χ2 test in c and d. *P < 0.05, **P < 0.01, ***P < 0.001

