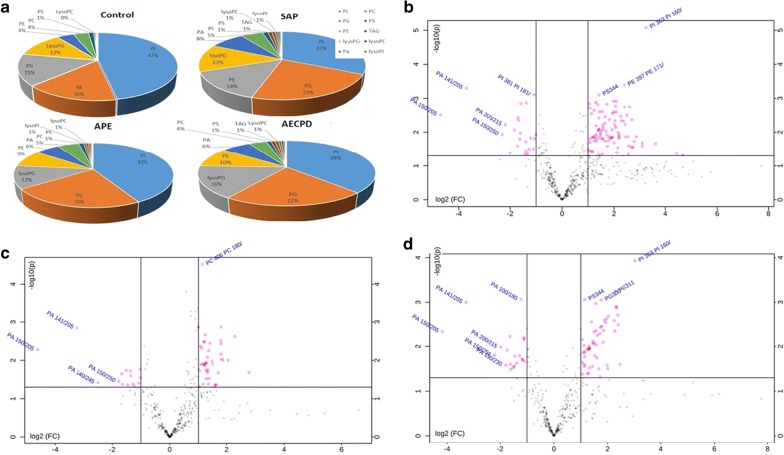
Fig. 7.
The proportion of main lipid components (a) in healthy patients or patients with severe acute pneumonia (SAP), acute pulmonary embolism (APE), or acute exacerbation of chronic pulmonary diseases (AECOPD). Volcano Plot with the transverse axis of the log2 (FC) and the longitudinal axis of − log 10 (p value) where every dot represents one lipid species of patients with severe acute pneumonia (b), acute pulmonary embolism (c), or acute exacerbation of chronic pulmonary diseases (d). The point outside the horizontal axis 1 means that the lipid element is more than twofolds higher than control group, whereas the one on the left side of − 1 is down-regulated by twofolds of lipid species. A line perpendicular to the Y axis is − log 10 (0.05), and points above this line indicate lipid species with significant difference < 0.05

