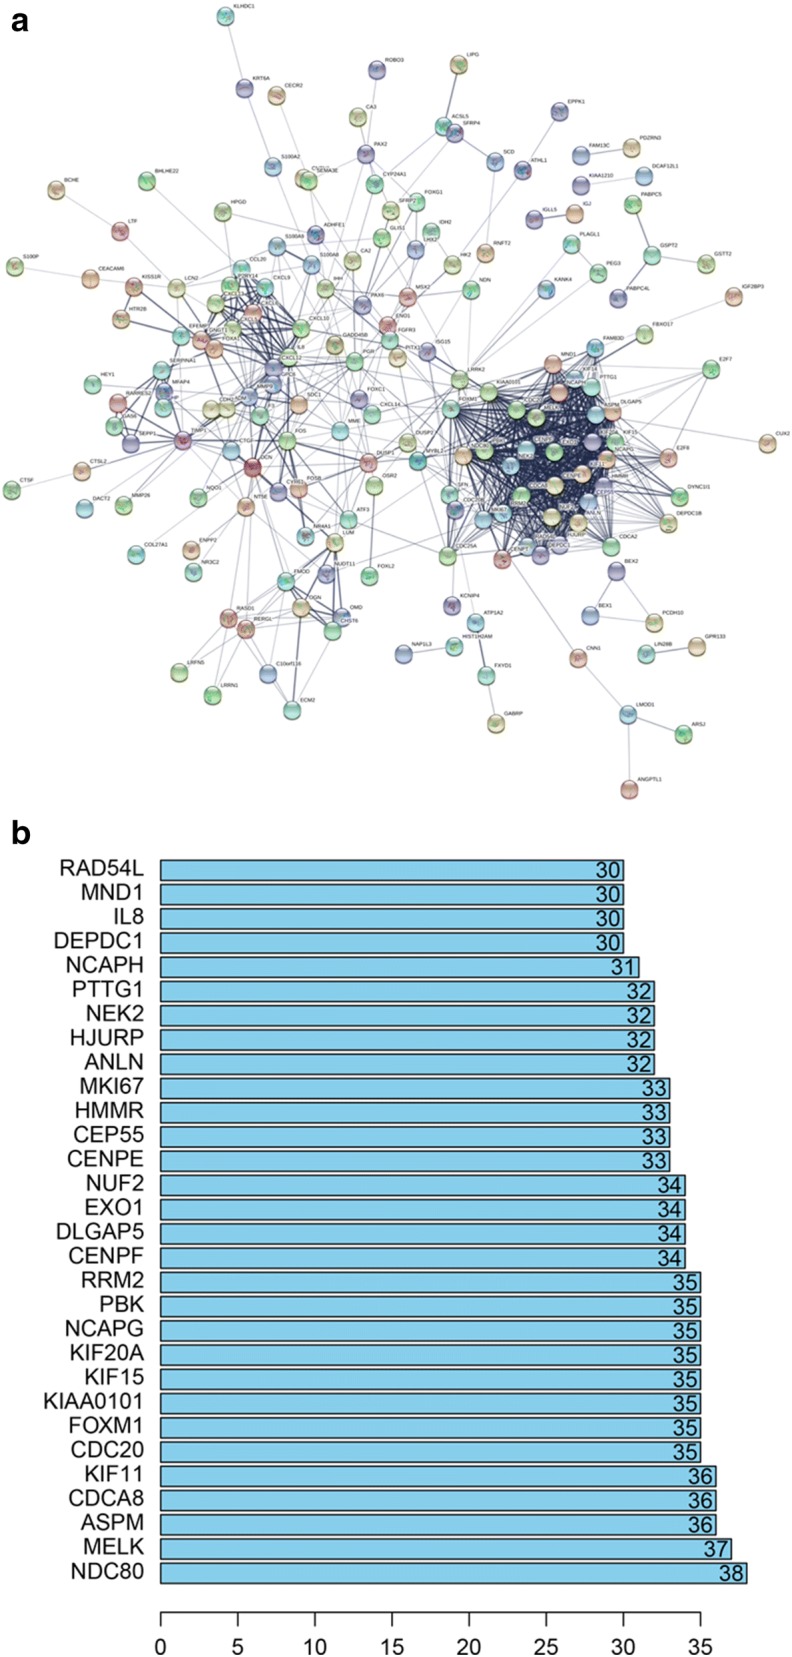
Fig. 2.

Cluster analysis of the PPI network. a 1737 DEGs were filtered into the DEGs PPI network complex that contained 256 nodes and 877 edges. b Histogram of key proteins. The y-axis represents the name of genes, the x-axis represent the number of adjacent genes, and height is the number of gene connections
