
Fig. 5.
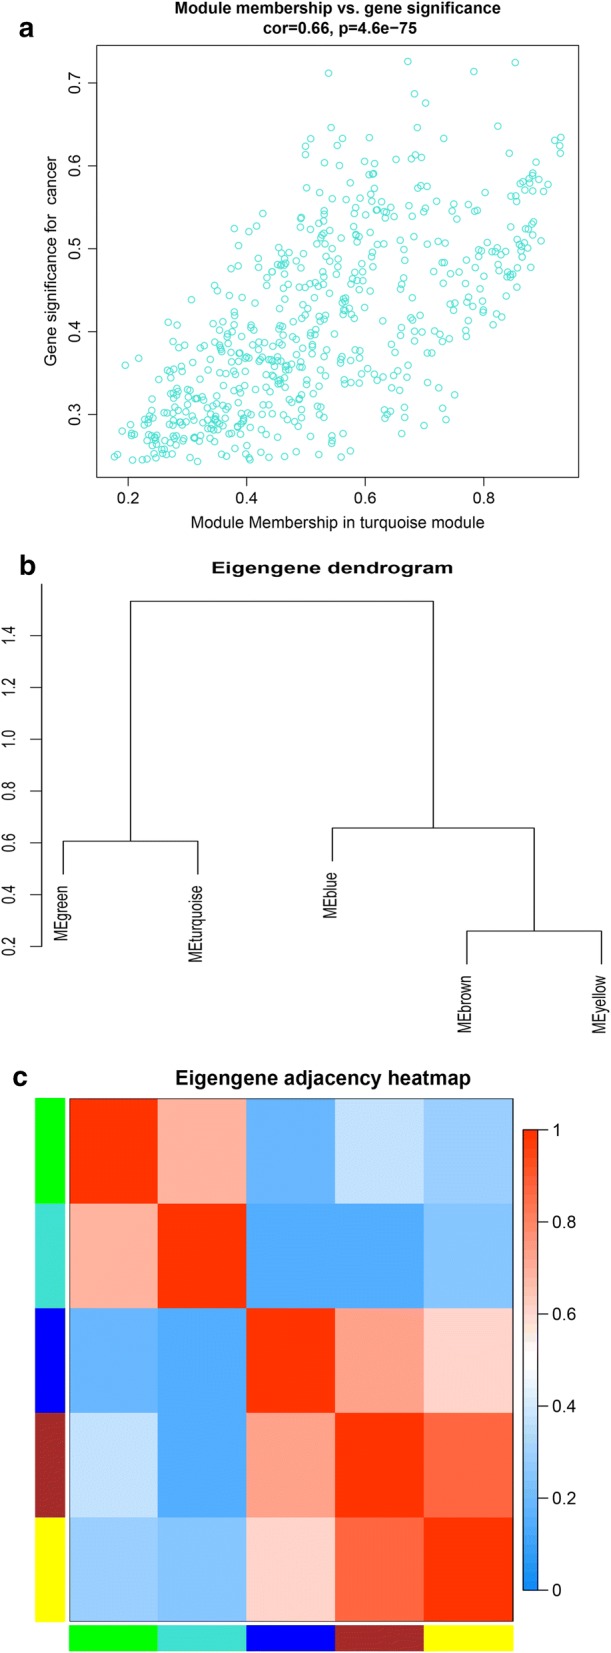
Select hub genes in hub modules. a A scatter plot of GS for EC versus the MM in the turquoise module. Intramodular analysis of the genes found in the turquoise module, which contains genes that have a high correlation with EC, with p < 4.6e-75 and correlation = 0.66. b Dendrogram of consensus module eigengenes obtained by WGCNA on the consensus correlation. c Heatmap plot of the adjacencies of modules. Red represents high adjacency (positive correlation) and blue represents low adjacency (negative correlation)