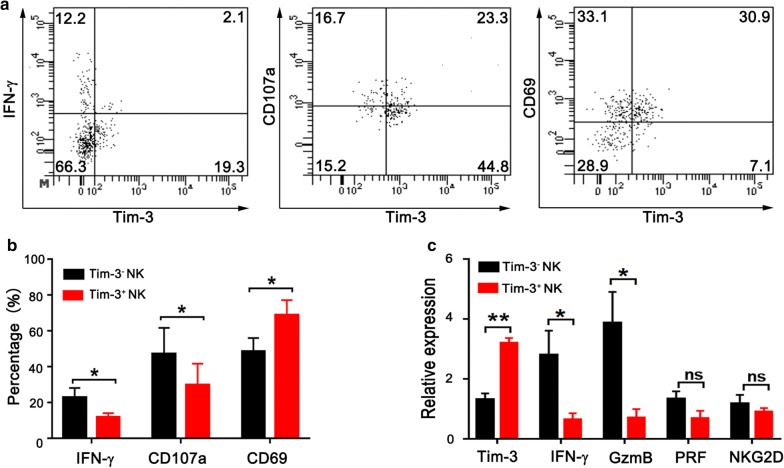
Fig. 3.
Tim-3+ NK cells display weaker activities than Tim-3− NK cells in TIL from esophageal cancer patients. a Representative flow plots of IFN-γ, CD107a and CD69 expression on Tim-3+ NK cells and Tim-3− NK cells. b Proportions of IFN-γ+ cells (n = 7), CD107a+ cells (n = 5) and CD69+ cells (n = 8) in Tim-3+ NK cells and Tim-3− NK cells, respectively. c Relative mRNA expression of Tim-3, IFN-γ, granzyme B (GzmB), perforin (PRF) and NKG2D in sorted Tim-3+ NK cells and Tim-3− NK cells, respectively (n = 5). *p < 0.05; **p < 0.01; ns, not significant

