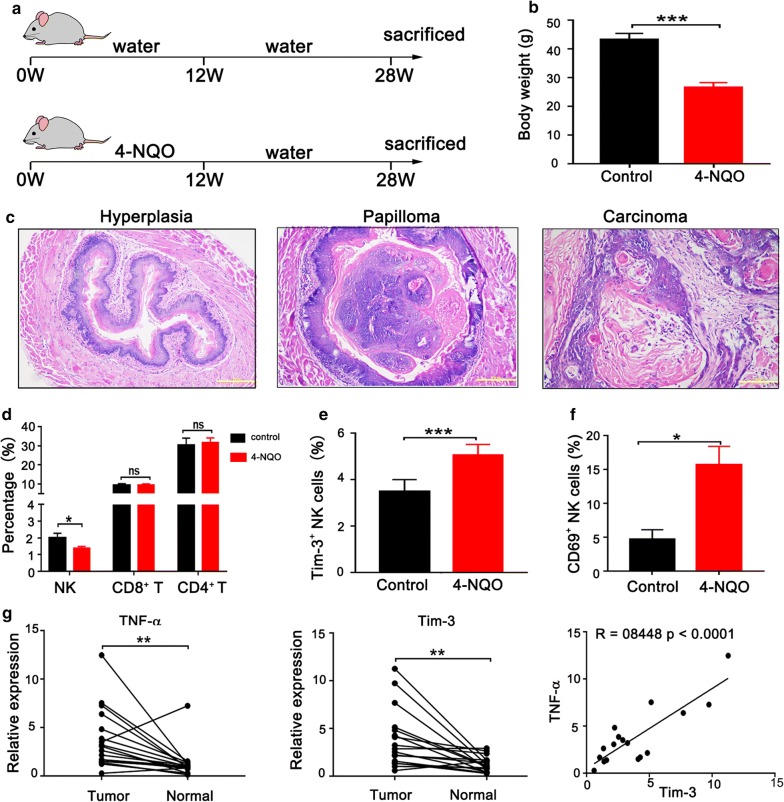
Fig. 5.
Characterization of NK cells in a murine esophageal cancer model. a Scheme of 4-NQO-induced carcinogenesis in C57BL/6 mice. b Average body weight of mice in control group and 4-NQO group before sacrifice. c Histological analysis of 4NQO-induced esophageal lesions in mice (×200). d Phenotypic analysis of splenocytes isolated from control group (n = 8) or 4-NQO group (n = 17) using flow cytometry. Flow cytometric analysis of Tim-3+ NK cells (e) and CD69+ NK cells (f) in splenocytes from control group (n = 5) or 4-NQO group (n = 10). g Relative mRNA levels of TNF-α and Tim-3 in esophageal tumor tissues and adjacent normal tissues from 4-NQO-induced mice (left panel) and a strong correlation between TNF-α and Tim-3 expression in esophageal tumor tissues (right panel). *p < 0.05; **p < 0.01; ***p < 0.001; ns, not significant

