Figure 4.
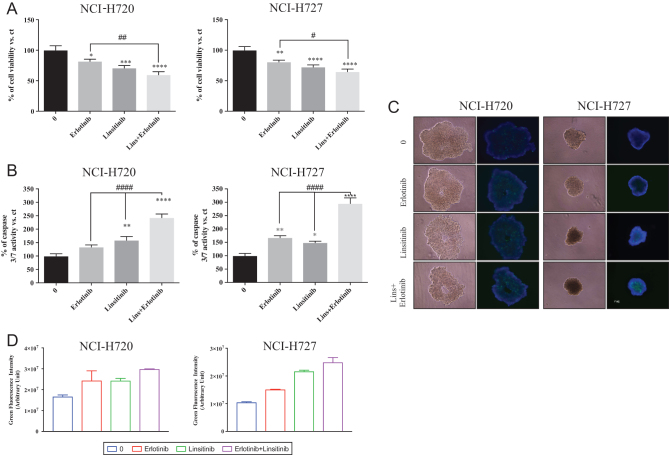
Effects of erlotinib and linsitinib on cell viability, caspase activation and spheroids structure in human BP-NEN cell lines. NCI-H720 and NCI-H727 cells were incubated in 96-well plates for 72 h in culture medium supplemented with 5 μM erlotinib and/or 5 μM linsitinib; control cells were treated with a vehicle solution. (A) Cell viability was measured as luminescent output in three independent experiments with six replicates each, and it is expressed as the mean ± s.e.m. *P < 0.05 vs vehicle cells or erlotinib; **P < 0.01 vs vehicle cells or erlotinib; ***P < 0.001 vs vehicle cells or erlotinib; ****P < 0.0001 vs vehicle cells or erlotinib. (B) Caspases activity was measured as luminescent output in three independent experiments with six replicates each and it is expressed as the mean ± s.e.m. *P < 0.05 vs vehicle cells or erlotinib; **P < 0.01 vs vehicle cells or erlotinib; ***P < 0.001 vs vehicle cells or erlotinib; ****P < 00001 vs vehicle cells or erlotinib. (C) Representative spheroids pictures were taken with EVOS FL Cell imaging System 72 h after treatment. NCI-H720 and NCI-H727 were treated as described above; pictures were taken without and with the fluorescent staining. The second and fourth columns in each plot represent the merge between the two fluorescence dyes detected. The blue dye stains the nuclei of all cells (excitation/emission maxima: 360/460 nm) while the green dye stains only the nuclei of dead cells with compromised plasma membranes (excitation/emission maxima: 504/523 nm). (D) Green fluorescence from spheroids was analysed using ImageJ software.

 This work is licensed under a