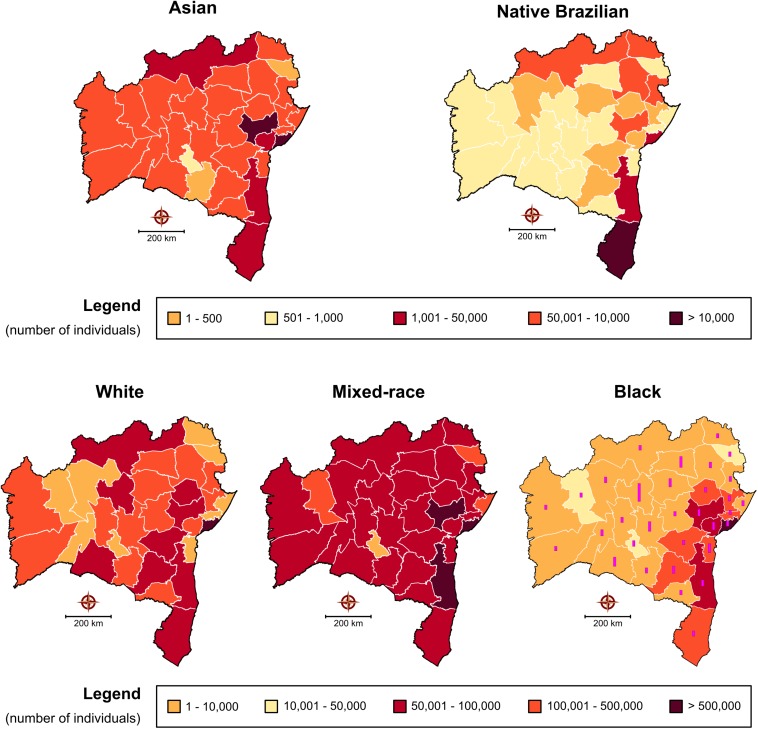
FIGURE 6.
Self-reported ethnicity/color of regional populations in the state of Bahia according to the Brazilian Institute of Statistics and Geography 2010 census. With respect to the representative map of individual identifying as “black,” bars represent the number of quilombola communities located in each mesoregion of the state (total number = 656).

