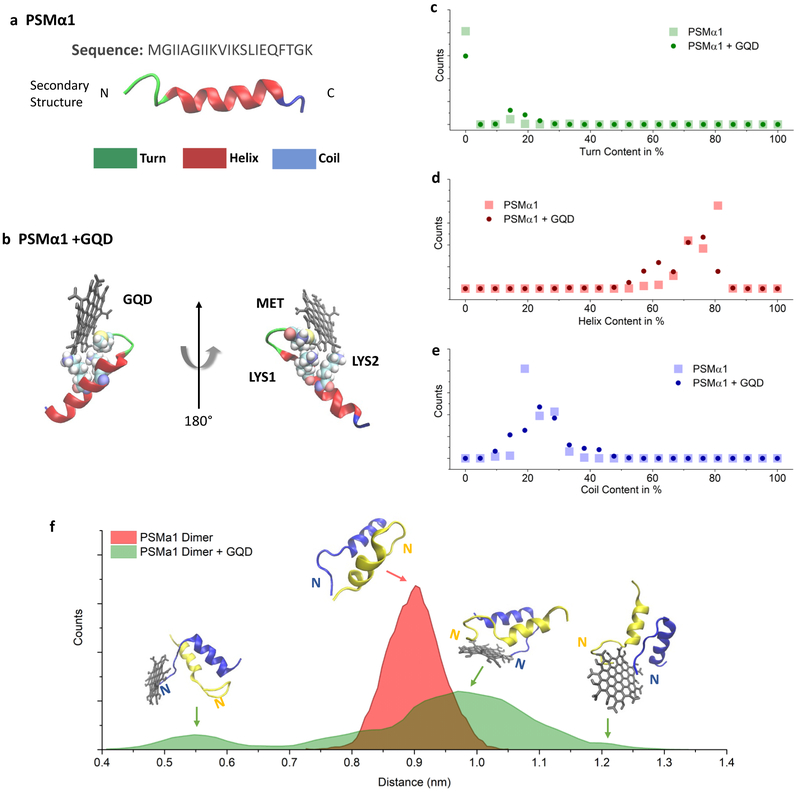
Figure 5. MD simulation of PSMα1 and GQDs.
Schemes of (a) PSMα152 and (b) PSMα1 and GQD complex, β-tiirns are shown in green, alpha helix in red and random coils in blue, (c-e) Histogram of secondary structure amounts in PSMα1 in the GQD/PSMα1 complex, (f) Histogram of the center of mass distance between two PSMα1 units showing the distance distribution with and without a GQD molecule. N: N-terminal of PSMα1; C: C-terminal of PSMα1.

