
Figure 1. FMD Cycles Ameliorate IBD-Associated Disease Phenotypes and Increase Colon and Small Intestine Lengths.
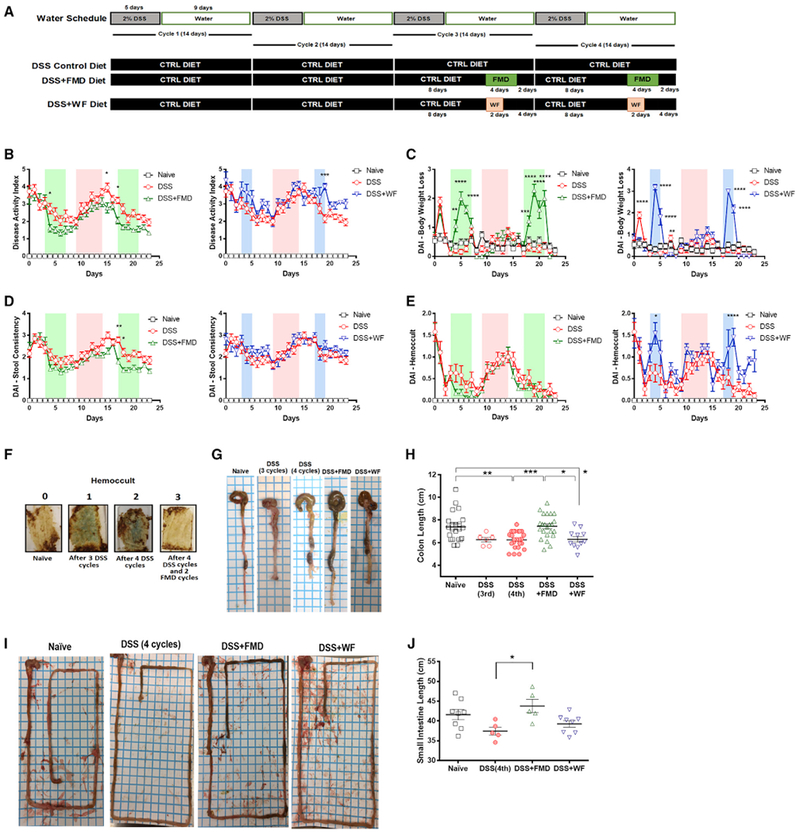
(A)Experimental scheme outlining the water schedule and duration of DSS, DSS+FMD, and DSS+WF diets.
(B) The modified disease activity index (DAI) scores (with body weight loss removed) of the Naive (n = 15), DSS control diet (DSS; n = 19), DSS control diet plus 2 cycles of FMD (DSS+FMD; n = 18), and DSS control diet plus 2 cycles of water-only fasting (DSS+WF; n = 11) groups starting after the third DSS cycle.
(C) The body weight loss variable of the DAI scores of the Naive (n = 15), DSS (n = 19), DSS+FMD (n = 18), and (DSS+WF; n = 11) groups starting after the third DSS cycle.
(D)The stool consistency variable of the DAI scores of the Naive (n = 15), DSS (n = 19), DSS+FMD (n = 18), and DSS+WF (n = 11)groups starting after the third DSS cycle.
(E) The Hemoccult test variable of the DAI scores of the Naive (n = 15), DSS (n = 19), DSS+FMD (n = 18), and DSS+WF (n = 11) groups starting after the third DSS cycle.
(F) Visual representation of Hemoccult test results for Naive group (0), after 3 cycles of DSS (1), after 4 cycles of DSS (2), and after 4 cycles of DSS and 2 cycles of FMD (3). Blue color indicates presence of blood in stool.
(G) Visual representation of colon length from Naive, DSS control diet after 3 cycles (DSS 3 cycles), DSS control diet after four cycles (DSS 4 cycles), DSS control diet after 4 cycles of DSS plus 2 cycles of FMD (DSS+FMD) and DSS control diet plus 2 cycles of water-only fasting (DSS+WF) groups.
(H) Colon lengths of the Naive (n = 22), DSS 3 cycles (n = 6), DSS 4 cycles (n = 24), DSS+FMD (n = 23), and DSS+WF (n = 11) groups.
(I) Visual representation of small intestine from Naive, DSS 3 cycles, DSS 4 cycles, DSS+FMD, and DSS+WF groups.
(J) Small intestine lengths of the Naive (n = 8), DSS (n = 5), DSS+FMD (n = 5), and DSS+WF (n = 8) groups.
Data are presented as mean ± SEM; *p < 0.05, **p < 0.01, and ***p < 0.001, one-way or two-way ANOVA, and Bonferroni post test.
Related to Figure S1.