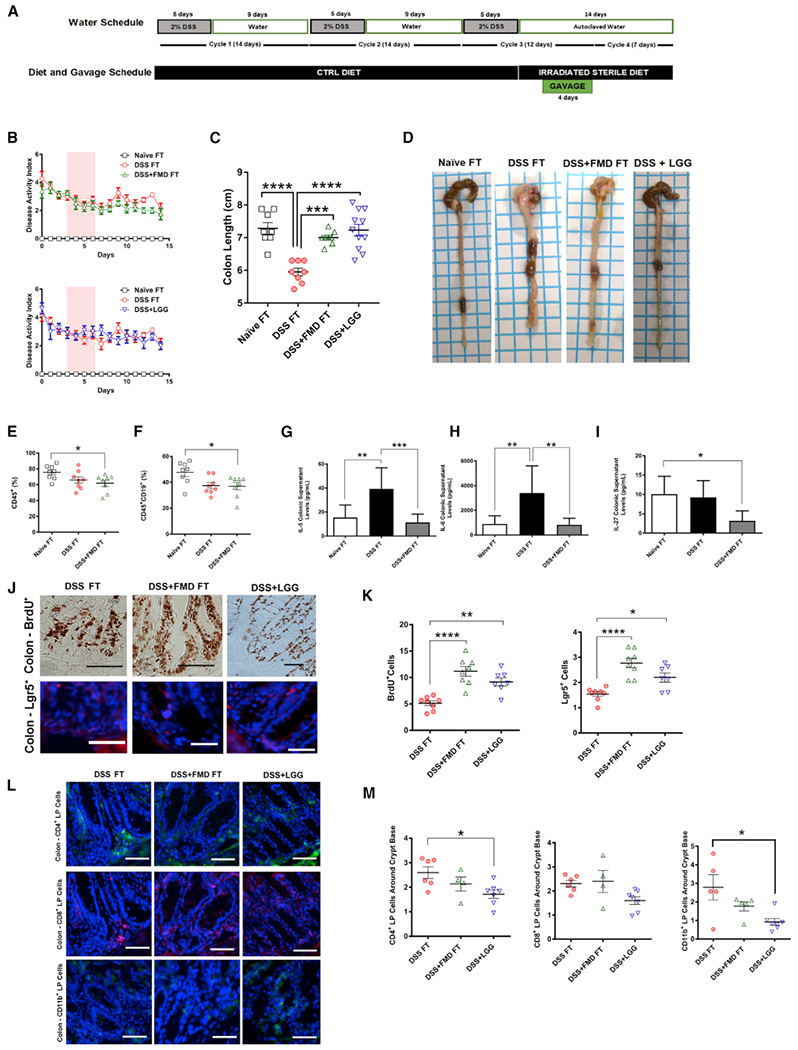
Figure 5. Fecal Transplant from FMD-Treated Mice Improves IBD-Associated Phenotypes, Alters Immune Cell Profile, Stimulates Regeneration in the Colon, and Reduces Levels of Cytokines Associated with IBD Pathogenesis.

(A) Experimental scheme outlining the water schedule, duration of diet, and transplant gavage.
(B) The modified DAI scores (with body weight loss removed) of the mice that received a control PBS-glycerol solution (Naive FT), mice that received 3 DSS cycles and a cecum-derived solution from mice in the DSS group (DSS FT), 3 that received three DSS cycles and a cecum-derived solution from mice in the DSS+FMD group (DSS+FMD FT), and mice that received three DSS cycles and a gavage treatment of the Lactobacillus strain Lactobacillus rhamanosus (DSS+LGG) groups starting after the third DSS cycle through the 4-day gavage treatment. Pink background represents period of gavage treatment.
(C) Colon lengths of the Naive FT, DSS FT, DSS+FMD FT, and DSS+LGG groups.
(D) Visual representation of colon length from the Naive FT, DSS FT, DSS+FMD FT, and DSS+LGG groups after 3 cycles of DSS, 4 days of transplant gavage, and a 1-week respite period.
(E) CD45+ leukocytes in splenocytes of Naive FT, DSS FT, and DSS+FMD FT groups.
(F) B Cells (CD45+CD19+) in splenocytes of Naive FT, DSS FT, and DSS+FMD FT groups.
(G) Colonic supernatant IL-5 levels (pg/ml) in Naive FT (n = 7), DSS FT (n = 7), and DSS+FMD FT groups.
(H) Colonic supernatant IL-6 levels (pg/ml) in Naive FT (n = 7), DSS FT, and DSS+FMD FT groups.
(I) Colonic supernatant IL-27 levels (pg/ml) in Naive FT, DSS FT (n = 7), and DSS+FMD FT (n = 4) groups.
(J) IHC for BrdU+ cells and IF staining for Lgr5+ cells in colonic crypts of the DSS FT, DSS+FMD FT, and DSS+LGG groups.
(K) BrdU+ and Lgr5+ cells in colonic crypts of the DSS FT, DSS+FMD FT, and DSS+LGG (BrdU+ and Lgr5+, n = 7) groups.
(L) IF staining for CD4+, CD8+, and CD11b+ colon lamina propria cells of the DSS FT, DSS+FMD FT, and DSS+LGG groups.
(M) Colon lamina propria CD4+, CD8+, and CD11b+ around the colonic crypt base of the DSS FT (CD4+, n = 6; CD8+, n = 6; CD11b+, n = 5), DSS+FMD FT (CD4+,n = 4; CD8+, n = 4; CD11b+, n = 5), and DSS+LGG (n = 7) groups.
Data are presented as mean ± SEM; *p < 0.05, **p < 0.01, ***p < 0.001, and ****p < 0.0001, one-way ANOVA, and Bonferroni post test. n = 8/group unless otherwise noted. Scale bar represents (J) 100 μm (BrdU+) and (J [Lgr5+] and L) 50 μm.
Related to Figures S4 and S5.
