
Figure 1.
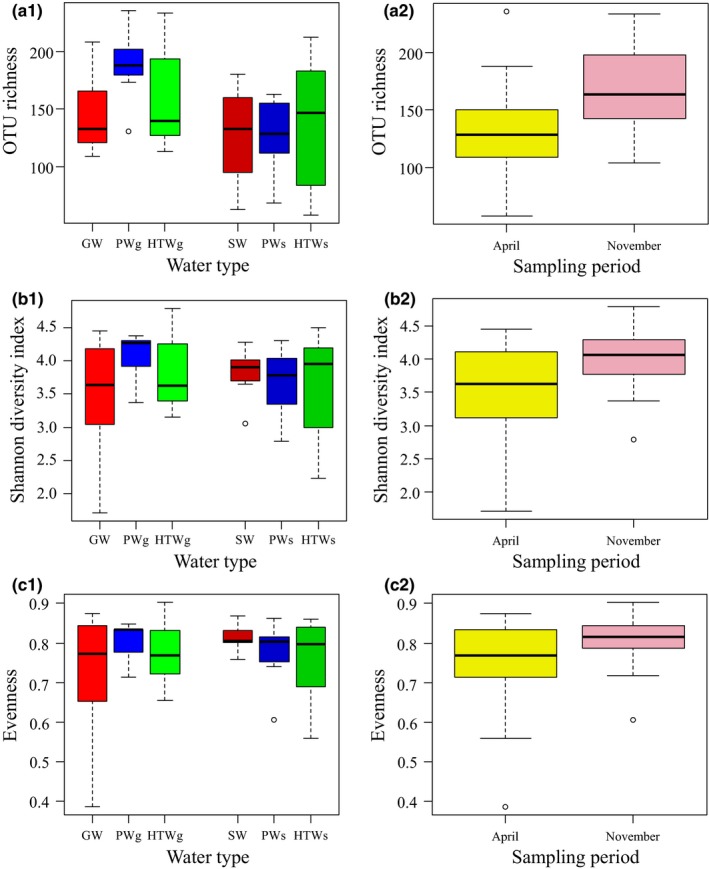
Boxplot representation of OTU richness (a), Shannon diversity (b), and Pielou's evenness (c) of the bacterial communities in the water samples investigated in this study. Water samples were grouped based on water type (a1, b1, and c1) and sampling period (a2, b2, and c2). The boxplots show the upper and lower quartiles; the whiskers indicate variability outside the upper and lower quartiles which is no more than 1.5 times the interquartile range. Further, the median is plotted as a thick black line. GW, groundwater (n = 7); PWg, processed water produced from groundwater (n = 7); HTWg, household tap water processed from groundwater (n = 7); SW, surface water (n = 7); PWs, processed water produced from surface water (n = 7); HTWs, household tap water processed from surface water (n = 6); April (n = 21); November (n = 20)