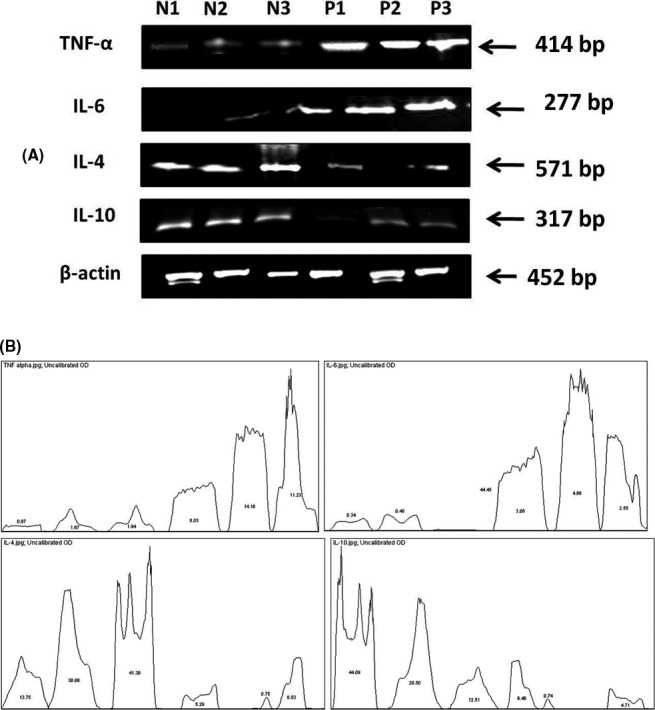
Figure 3.

Reverse transcriptase PCR analysis of the preeclamptic (P) and normal (N) placental tissues on representative samples. A, mRNA transcripts of all proteins where N1, P1 represents Group I samples and N2, N3, P2, P3 represents Group II samples. β‐actin was used as control. B, Quantification of the mRNA transcripts of IL‐6, TNF‐α, IL‐4, IL‐10 where the values in the curve represents the percentage of the samples
